
The Market Is a Graph. The Deal Process Still Treats It as a Document.

Demand, supply, assets, permits, ownership, technology and signals are connected entities. Every artifact in a transaction flattens them into prose and a single number, and the flattening is where the information dies. The thirty-interview market study is not the problem — it is what you produce when there is no graph underneath you. A market has a shape, and it is not a page A waste market is not a number. It is tens of thousands of generating sites producing particular streams at particular volumes and prices; a few thousand operators with trucks, permits and processing assets; contracts connecting the two; disposal and reuse outlets at the end of every route; owners above the operators; and a continuous stream of filings that tells you when any of it changes. What matters commercially is not the entities but the edges between them — which generator is served by which hauler, into which facility, at what haul distance, under what contract, at what price. Density economics live on the edges. So does whitespace, and so does acquisition logic. Every artifact in a transaction flattens that structure. The market study renders it as a paragraph and a growth rate, the CIM as a share estimate against a total, the IC memo as a sensitivity table. Each flattening is lossy and none is reversible: you cannot get the sites back out of the TAM. The question is not whether the market can be described. It is whether the description can be interrogated. A number can only be believed or disbelieved. A graph can be traversed, filtered, disputed and corrected — which is what underwriting actually requires. One market, seven builds, no shared object The cost of having no persistent object shows up in how often the market gets rebuilt. Between mandate and exit, a mid-market platform’s market is built from scratch seven or eight times, by parties who cannot reconcile their work to each other. The market did not change seven times. The representation of it did. None of this is a criticism of the people doing the work — with nothing structured to inherit, starting over is the rational choice. The architecture is the problem, not the practitioners inside it. What sits underneath: eight layers, one graph The alternative to a study is not a better study. It is a persistent entity graph that the study, the CIM, the diligence pack and the value-creation plan all read from. “Graph” is only a useful word if the schema is specific, so here is ours. Eight layers, each populated from named sources, each carrying an explicit confidence tier — Observed for filed or identified records, Modelled for figures derived from observed inputs under a stated assumption, Strategic for anything requiring capex, acquisition or capability that does not yet exist. Two layers deserve honesty rather than promotion. Patents are load-bearing in treatment and technology-differentiated assets and close to irrelevant in route-based collection, where defensibility is density and permits; the layer earns its place in perhaps one build in four. Signals are the noisiest: a new permit application is a real event, a local news item usually is not, and the discipline is in what gets attached to a node rather than in how much gets ingested. The value is in the edges, and the edges are what nobody has Anyone can download a facility list. Public records are free and have been for years, which is the obvious objection to all of this: if the data is available, why has the method not already displaced the convention? Because records arrive as disconnected nodes. Nothing in them says which generator ships to which processor, or which of four legal entities is one operating company. The same business appears as three entities in a state license file, under a trade name in the carrier registry, under an acquired name in a permit file nobody updated after the deal, and under the parent in procurement records. There is no common key. Building the graph is therefore mostly resolution, not acquisition — companies to operating entities, entities to sites, sites to streams, streams to volumes, volumes to prices, customers to the suppliers actually serving them. Each of those is an edge, and each edge is inferred, evidenced and tiered rather than found. That economics makes the graph a firm-level asset rather than a project deliverable: largely a fixed cost, incurred once per vertical and amortized across every subsequent build in it. It is also why this arrives through specialists rather than as a feature of the incumbent model. The thirty-interview study is what you produce when there is no graph Set the graph aside and look at how a market gets sized today. The methodology page tells you: twenty-five, thirty or forty interviews with customers, competitors and industry experts, supported by industry reports and public sources. It is usually page four, and almost never read. Read it on the next three studies that cross your desk and count. Then ask one question: if four of those thirty conversations had gone to four different people, what would the market size in the executive summary be? Nobody can answer that. That is the finding. This was not lazy — it was correct. Twenty years ago competitors disclosed little, government records sat in county offices and scanned PDFs, and operating data had no common identifier. Assembling a graph cost more than it was worth. That condition no longer holds: the EPA’s ECHO Exporter alone publishes summary records for more than 1.5 million regulated facilities across 130-plus fields, refreshed weekly, with coordinates where available. One caution, because it demonstrates the discipline the graph is built on. That figure is the ECHO Exporter registry file; the EPA describes ECHO’s integrated compliance history as covering roughly 800,000 facilities. The two answer different questions, and a study citing the larger to support a claim only the smaller carries will be found out. At graph scale, an unresolved distinction like that propagates into every edge built on
The Real Risk in Biosolids Is Losing the Outlet
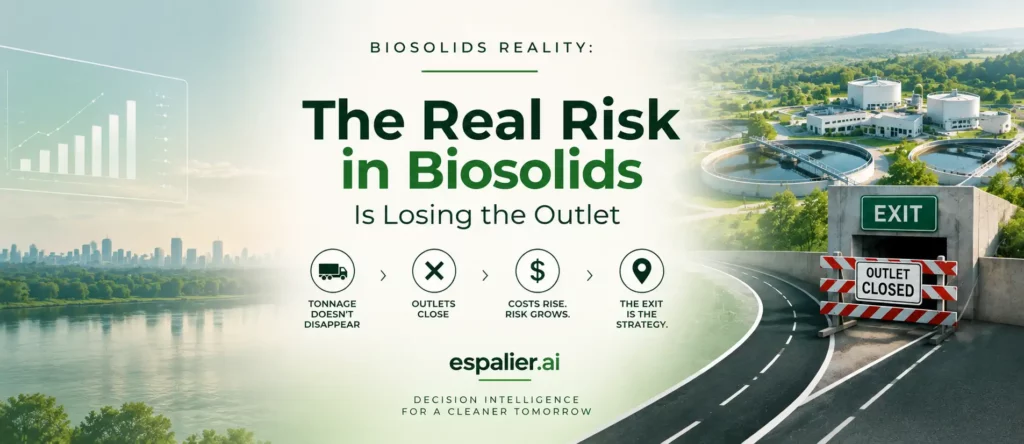
When a disposal outlet closes, the tonnage doesn’t disappear — it moves, farther and at higher cost. The scarce resource in biosolids is no longer processing capacity. It is a reliable place to put the material. Roughly 24,000 U.S. wastewater plants cannot stop producing biosolids, and the national bill for managing them is projected to nearly double — from about $2.5 billion in 2025 to more than $4.8 billion a year by 2035. The pressure isn’t coming from the volume of material; it is coming from the shrinking set of places that material is allowed to go. Land application, landfill, and incineration remain the principal pathways, but each is tightening under regulatory, capacity, economic, and community pressure — most of all around PFAS. When an established outlet becomes constrained, the underlying tonnage does not fall. It reroutes — often at a higher cost and across a more complex logistics network. The relevant measure of a biosolids platform is not how many tons it can process. It is how many tons it can reliably place after processing. Outlet loss is already repricing the market This is not a forecast. Three markets show how quickly the loss of a single outlet moves from a disposal question into price, margin, and permit risk. Exhibit 1 — When the outlet closes: three markets, three failure modes. Same root cause, three distinct ways it hits the P&L: price inflation, margin and mix erosion, and operational or permit risk. PFAS turns outlet resilience into the whole game Utilities do not generate PFAS — they receive it through incoming waste streams, and once in the system it becomes associated with the sludge. That makes every outlet a question of durability, not just current compliance: an outlet that works economically today may face new testing, acceptance criteria, or public scrutiny tomorrow. The federal posture has made this immediate — EPA’s designation of PFOA and PFOS as hazardous substances created new liability for utilities, and its July 2026 draft biosolids guidance signals where risk-reduction expectations are heading. The cost signal is already measurable: one analysis found PFAS rules raised biosolids management costs by roughly 37%, with facilities in regulated states seeing management costs more than double. In that environment, processing capabilities acquire option value. Technologies that cut volume, improve material characteristics, or widen the set of acceptable pathways are worth more than their unit economics suggest, because they add exits when a pathway closes. The lowest-cost outlet, in other words, is rarely the lowest-risk strategy. For investors, diligence moves past tonnage Tonnage measures scale; it does not measure the durability of that scale. Two platforms managing similar volumes can carry opposite risk profiles if one holds diversified, secured outlets and the other leans on a handful of destinations. The diligence questions that matter sit at the end of the chain: outlet concentration, remaining capacity, transportation radius, contractual protections, exposure to landfill pricing, processing flexibility, and credible contingency routes. Exhibit 2 — Tonnage tells you the size of a platform; outlet security tells you its durability The strategic implication follows directly. Value is migrating toward businesses that control scarce permitted infrastructure, maintain diversified outlet networks, or hold processing that expands the range of viable destinations. The thesis is no longer simply capturing biosolids volume — it is controlling enough of the management chain that the volume always has somewhere economically viable to go. THE ESPALIER VIEW “Outlet resilience” sounds like a narrative. It is actually a measurement. Every generator’s available outlets, their PFAS and regulatory exposure, the haul radius to each, and the contingency behind them can be mapped and scored — turning a platform’s durability into a number before capital commits. Which is why the interesting question about a biosolids business is not how many tons it controls. It is how many ways it has to move them when a pathway closes. THE BOTTOM LINE Biosolids generation is unavoidable; access to any single outlet is not. As PFAS scrutiny, regulation, capacity limits, and local acceptance reshape the market, maintaining multiple viable pathways becomes a durable competitive advantage. In a market where the tons don’t disappear when an outlet does, controlling where those tons go may ultimately matter more than the ability to collect them.
A Waste-Management Growth Story You Can Trace, Not Just Trust
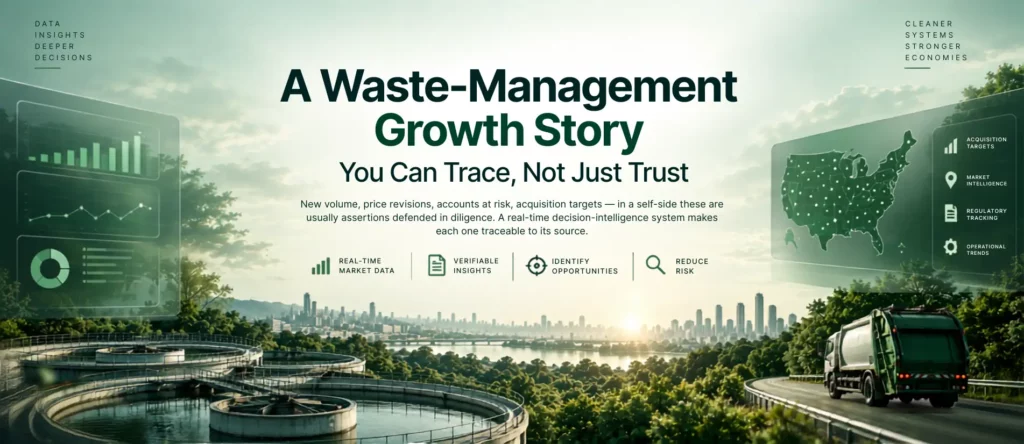
New volume, price revisions, accounts at risk, acquisition targets — in a sell-side these are usually assertions defended in diligence. A real-time decision-intelligence system makes each one traceable to its source. M&A is being rebuilt around real-time data. Origination, underwriting, and execution are all moving from periodic, assumption-driven analysis toward systems that read the market continuously — and that shift will reshape every stage of a transaction. It shows up first, and most visibly, in the document where a deal begins: the sell-side Confidential Information Memorandum, and specifically its growth story. A growth forecast in a waste-management CIM is, underneath the model, a set of claims: more tons, better price, retained and new accounts, a few well-chosen acquisitions. Historically each claim is a static assumption — built once at the start of the process and defended, question by question, through diligence. Buyers know this, so they discount the growth bridge; it is routinely the most heavily repriced page in the book. But waste management is an unusual industry. The data that would prove those claims is largely a matter of public record, even if it is scattered rather than centralized — manifests and shipment records, facility permits, biennial reports, generator and discharge data, procurement and contract records, technology patents, and transaction filings. Assembled and connected, that data can turn the growth story from something a buyer must trust into something a buyer can trace — giving every point of growth an address. You no longer have to assert where growth comes from. You can point to it. A ton of new volume traces to a specific generator, a new plant, or a regulation. A price increase traces to a capacity or permit constraint you can see. An account at risk traces to a contract clock or a lost outlet. A target traces to a scarce permit. The growth bridge stops being a forecast to trust and becomes a map to inspect. What a decision-intelligence system changes This is where a decision-intelligence system changes the sell-side. It turns the growth bridge from a static forecast into a traceable, continuously current view of where growth comes from — powered by a real-time knowledge graph, a real-time model of the industry that connects six data layers so any claim about volume, price, an account, or a target can be followed back to the signal behind it. The datasets exist elsewhere in fragments; the system’s advantage is that they are joined and live. Exhibit 1 — What powers the system: a knowledge graph’s six real-time layers Because these layers are connected, a single change propagates through the system as a chain a buyer can follow: a state PFAS rule (demand) restricts a land-application outlet (permits), which reroutes tonnage to a more distant incinerator (supply), lifting gate rates (price) and raising the value of whoever holds that permitted capacity (transactions). That chain is the growth story — made explicit. Every growth decision, traced The organic-to-inorganic discipline that buyers already expect — start with what the business delivers today, then what current initiatives add, then what acquisitions contribute — is sound; McKinsey’s large-deal research found 72% of successful deals maintained organic growth in year one against just 33% of unsuccessful ones. The system makes that discipline executable rather than asserted, because it can trace each moving part of the forecast to its source. Exhibit 2 — In waste management, each growth decision traces to a specific signal in the system The same traceability disciplines the acquisition case. Showing that hundreds of operators exist demonstrates fragmentation; showing which of them hold scarce permits, fit the density or geography the platform needs, and are actually reachable demonstrates a pipeline. That distinction is where value compounds — McKinsey’s programmatic-M&A research found companies completing one to two acquisitions a year grew roughly twice as fast as those doing none. The system turns the target universe from a static list into a funnel that narrows continuously as the thesis sharpens. Exhibit 3 — The target universe narrows — and becomes actionable — inside the system Why waste management — and why “public” doesn’t mean easy This approach works in waste management for a reason that also explains why few can execute it. The industry runs on a public record: shipment manifests, facility permits, biennial and discharge reports, financial-assurance filings, procurement and contract records, technology patents, and transaction disclosures are all, in principle, observable. In most industries demand and supply must be inferred from private data; here, the regulatory record is the demand-and-supply signal. The catch is that the signal is scattered. It sits across thousands of separate sources — federal databases, fifty state agencies, county health departments, municipal procurement portals, and individual facility permits — in inconsistent formats, on different update cadences, rarely joined and never in one place. Access is not the barrier; assembly is. Turning that fragmented record into a connected, continuously current view of generators, outlets, permits, technology, and transactions is a substantial and ongoing undertaking — which is exactly why it is a source of advantage rather than a commodity. The data is available to anyone; the system that makes it traceable is not. The static growth projection can be replaced now, not eventually — but only by whoever has already done the work of connecting the record. Transparency raises value — it doesn’t leak it The instinct that a traceable growth bridge gives too much away runs backward. In an analysis of 1,640 transactions, McKinsey found that acquirers who disclosed the sources of expected deal value drew a more positive market response and about six percentage points more two-year excess shareholder return than those who did not. A CIM is not a public announcement, but the principle holds: capital pays more for growth it can see. Buyers will separate organic from acquired growth, test capacity and permit assumptions, and scrutinize the pipeline regardless. A CIM built on the system anticipates those questions — and answers them with the same data the buyer would otherwise spend
PFAS Forces a Technology Reckoning: From Capture to Destruction

Pyrolysis, gasification, and the emerging economics of PFAS treatment PFAS is forcing the waste industry to confront an uncomfortable distinction: removing a contaminant is not the same as destroying it. For years, the PFAS management conversation has centered on detection, filtration, capture, and containment. The objective has largely been to remove PFAS from water, air, soil, or other waste streams and concentrate it into a manageable residual. But concentration does not make PFAS disappear. PFAS captured from wastewater can end up in biosolids. PFAS removed through treatment can accumulate in spent media or other concentrated residuals. Those materials still need to be transported, treated, reused, or disposed of. That creates a strategic question for the waste industry: are we actually solving the PFAS problem, or simply moving it further down the waste chain? The answer is beginning to reshape the technology landscape. From capture to destruction The next phase of PFAS management is increasingly focused on what happens after capture. This is why thermal processes, particularly pyrolysis and gasification, are attracting attention. Unlike conventional separation technologies, these approaches offer the potential to combine contaminant treatment with substantial volume reduction and, in some applications, energy recovery. Pyrolysis uses an oxygen-limited or oxygen-free environment to thermally decompose material, producing outputs such as gas, liquid, and char. Gasification uses limited oxygen, air, or steam to convert carbon-based material into a combustible gas or syngas. The attraction is therefore not simply temperature. It is the possibility of moving from capture, concentrate, transport, and dispose toward treat, destroy, verify, and manage residuals. That distinction could fundamentally change the economics of PFAS management. But mass reduction is not destruction This is where the technology debate needs more discipline. EPA research has reported more than 90% volume reduction of biosolids under certain pyrolysis and gasification conditions. A pilot pyrolysis study also reported estimated target PFAS removal efficiencies ranging from more than 81.3% to more than 99.9%, depending on the compound and test conditions. Those figures are promising, but they should not be interpreted as proof that a technology has completely destroyed PFAS. A 90% reduction in material volume is not the same as 90% PFAS destruction. The critical question is what happens to the PFAS and fluorine during the process. Does it move into gas or vapor? Does it remain in char or ash? Does it enter a liquid phase? Are transformation products created? And can those outcomes be consistently measured and controlled? Recent laboratory work reinforces why these questions matter. Some pyrolysis studies found targeted PFAS largely removed from resulting biochar while PFAS or transformation products appeared in the liquid phase. In other words, disappearance from the original feedstock is not enough. Where the PFAS goes matters as much as how much appears to disappear. The new PFAS technology scorecard As PFAS treatment technologies mature, the market will increasingly evaluate them against five questions. These dimensions move PFAS from being primarily a regulatory question to becoming a technology and capital-allocation question. The market will increasingly reward technologies that can demonstrate not just technical promise, but defensible performance across the full treatment pathway. The commercial gap is the real battleground A process can demonstrate impressive destruction results under controlled laboratory conditions and still fail commercially. The commercial question is much harder: can the process handle variable feedstocks, maintain performance over time, control emissions and residuals, verify PFAS destruction at operating scale, obtain regulatory acceptance, and compete economically with available alternatives? That is the gap between promising science and infrastructure. For technology companies, it means that headline performance metrics will become less important than repeatable, independently verifiable commercial results. For investors, it means distinguishing technologies that can destroy PFAS under controlled conditions from platforms that can do so reliably and economically at scale. The opportunity may be bigger than pyrolysis and gasification Pyrolysis and gasification are important technologies to watch, but they may represent only part of the emerging PFAS destruction ecosystem. A commercially viable pathway may require an integrated chain spanning characterization, pretreatment, destruction, emissions control, residual management, and verification. The companies capable of integrating these capabilities could ultimately capture more value than companies offering a standalone treatment technology. That creates opportunities beyond technology licensing and across environmental services, infrastructure development, M&A, and private capital. It also changes the competitive position of waste operators, because the value proposition increasingly becomes what happens to the contaminant after it enters the system. What this means for waste operators The competitive advantage could shift from capacity to capability. Historically, an operator’s value proposition could be framed around how much material it could accept, process, transport, or dispose of. PFAS introduces a different question: what happens to the contaminant after it enters the system? Operators that can offer credible pathways from characterization through treatment, destruction, residual management, and verification may be positioned differently from operators whose networks remain dependent on containment and disposal. The asset that matters may therefore become less about individual processing capacity and more about the flexibility and reliability of the entire treatment network. What this means for technology companies and investors Technology providers will increasingly be judged on commercial proof rather than technical promise. That means demonstrating repeatable destruction performance, transparent measurement and verification, controlled residuals, regulatory acceptance, reliable operations, competitive economics, and a credible path to commercial scale. For investors, PFAS could create a new environmental technology investment cycle. But the opportunity is unlikely to be defined by technology alone. The more interesting question is which companies can connect science, regulatory acceptance, operational reliability, and commercial economics. That combination is what separates a technology that remains promising from one that becomes infrastructure. This also creates a broader strategic lens for M&A. Investors may find value not only in individual destruction technologies, but in the surrounding infrastructure: feedstock characterization, pretreatment, emissions management, residual handling, verification, logistics, and established waste networks. The eventual winners may be the companies that control the system rather than a single piece of it.
The Capacity Cliff
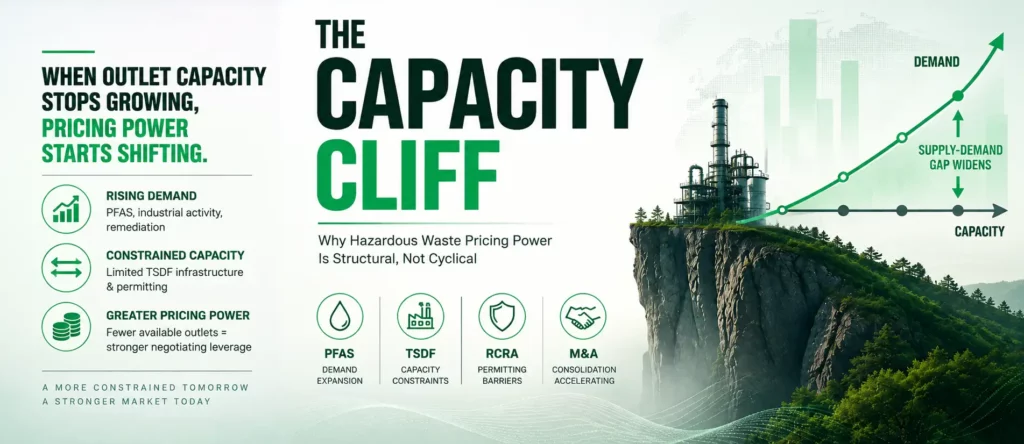
Why permitted hazardous waste infrastructure is repricing into one of the most valuable asset classes in environmental services The bottom line The U.S. hazardous waste market is undergoing a structural repricing, not a cyclical one. For two decades, gate rates tracked the industrial cycle — volumes rose with output, fell with contraction, and capacity absorbed the swings. That mechanism is breaking. A durable gap is opening between regulatory obligation and physical treatment capacity, and it cannot be closed on any commercially relevant timeline. Three forces drive the shift: PFAS remediation converting into permanent treatment demand; a permitting regime that prevents supply from responding; and consolidation that concentrates control of the scarce assets that remain. Together they form a self-reinforcing loop — scarcity confers pricing power, pricing power reprices the asset, and the repriced, un-buildable asset makes acquisition the only path to growth, which concentrates capacity further. The consequences run well past disposal pricing. They reshape capital allocation, M&A, and commercial strategy across environmental services. For operators and investors, the question is no longer where are we in the cycle, but who controls the permits, and who can see the market clearly enough to use them. PFAS rewrites the demand curve — permanently The treatment pathways are narrow. EPA’s 2026 interim guidance recognizes only a handful of routes that minimize environmental release: high-temperature thermal destruction, generally above 1,100°C; Class I underground injection at a small number of licensed wells; and lined hazardous waste landfill for certain solids. Each depends on infrastructure that already exists. Almost none is arriving soon. The demand behind those pathways is vast and durable. The Department of Defense has identified more than 700 installations contaminated by decades of AFFF firefighting foam. In December 2025, Clean Harbors secured $110 million over three years for PFAS water filtration at a single site — Joint Base Pearl Harbor–Hickam. Municipal leachate, industrial sites, and new effluent limits represent demand layers that have barely begun to convert into disposal volume. This is the defining feature: PFAS does not peak and normalize. Once contamination is identified, the obligation survives any downturn. The demand is durable. The infrastructure is finite. PFAS is not building a new market beside the existing one — it is competing for the same constrained capacity already serving industrial generators. Supply cannot answer — the permitting moat In most capital-intensive industries, sustained high returns attract entrants, capital flows in, and prices normalize. In hazardous waste, that mechanism is largely broken — by design. The binding constraint is not capital. It is the permit. A new TSDF, incinerator, or hazardous waste landfill must clear federal RCRA permitting — a three-year minimum, including trial-burn testing and MACT compliance under 40 CFR Part 63 Subpart EEE — alongside a parallel state authorization track, air permitting, environmental-justice review, community opposition, and frequent litigation, all before committing hundreds of millions in capital. The process routinely runs five to ten years, and approval is never assured. The evidence is in what little new supply exists. Fewer than two dozen commercial hazardous waste incinerators operate in the United States. Clean Harbors’ Kimball, Nebraska unit — the most significant new commercial capacity added in North America in years — only came online in late 2024 and is still ramping. Veolia’s roughly $300 million Gum Springs, Arkansas incinerator, originally slated for 2025, has slipped toward 2027. New supply consistently arrives years behind demand. The consequence reframes how these assets should be valued. Many of the most valuable facilities operating today could not be replicated within a commercially relevant timeframe at any price. The permit matters more than the equipment. Scarcity reprices the asset — the permit, not the equipment When an asset cannot be reproduced, its price reflects scarcity rather than cost of construction. Hazardous waste infrastructure is now repricing accordingly. Historically, treatment facilities were valued on throughput and EBITDA. Increasingly, the market values the embedded permit — an irreplaceable, multi-year, multi-agency entitlement that confers the economics of an infrastructure business: high barriers to entry, limited competition, recurring demand, long asset life, and durable pricing power. The discipline of the major operators makes the repricing visible. Clean Harbors, the dominant North American platform at roughly $5.9 billion in 2024 revenue and largely recurring volume, executed mid-single-digit price increases in 2025 — not during a demand spike, but as the normalized management of a constrained asset base. For investors, this is the value proposition rather than a risk. M&A multiples for specialty hazardous waste platforms increasingly reflect the scarcity value of permits, not just EBITDA run-rate. The moat is regulatory, geographic, and temporal — and it cannot be purchased in a single transaction, built on a short timeline, or replicated by a well-capitalized new entrant. Acquisition becomes the only growth lever — and consolidation compounds the moat If capacity takes a decade to permit and build, then acquiring existing capacity becomes the only practical way to grow. This is where the loop closes. Scarcity reprices the asset; the repriced, un-buildable asset forces growth through acquisition; acquisition concentrates control of scarce capacity in fewer hands; and concentrated control reinforces the pricing power that started the cycle. That dynamic is already visible in the most consequential relationship in the sector. In 2024, Clean Earth signed a first-of-its-kind, five-year guaranteed-access agreement for incineration capacity at Veolia’s Gum Springs facility — an explicit acknowledgment that capacity had become a strategic asset rather than a commodity. By early 2026, that arms-length relationship had become an outright acquisition: Veolia is buying Clean Earth, internalizing the very capacity the agreement had reserved. A contract to secure scarce capacity resolved into ownership of it. That is the flywheel in a single deal. Buyers in this market are no longer acquiring EBITDA. They are acquiring permits, treatment capability, geographic coverage, customer relationships, and — above all — scarce capacity that cannot be built. As the supply-demand gap widens, the strategic value of those assets rises, and the only practical way to acquire the moat is to acquire the
The Consolidation Decade

What 2,544 U.S. Waste Management M&A Transactions Reveal About Where the Industry Is HeadedThe U.S. waste management industry has been one of the most active M&A arenas in American business over the past six years. Between 2020 and Q1 2026, 2,544 transactions were completed across the full spectrum of waste management — from municipal solid waste and hazardous materials to liquid waste, food waste, and specialty environmental services. That volume is not accidental. It reflects a sector mid-transformation, driven by capital availability, regulatory pressure, demographic tailwinds, and the logic of scale in a historically fragmented industry. The dealmakers at the top of the league tables are not simply buying revenue — they are assembling infrastructure systems. Understanding the M&A patterns of 2020–2026 is, in large part, understanding where the industry is going. This article draws on Espalier’s proprietary transaction dataset — the most comprehensive tracking of U.S. waste management M&A available — to examine the forces shaping deal activity, the strategic logic of the most active acquirers, and what the next phase of consolidation will look like. The Volume Story: An Industry That Did Not Slow Down At the aggregate level, the data tells a story of sustained, high-intensity deal activity interrupted by a single-year digestion period — not a structural decline. Deal volume rose sharply from 269 transactions in 2020 to a peak of 503 in 2021 — a 67 percent increase driven by pent-up demand from the pandemic pause, historically low interest rates, and significant PE capital deployed at scale. 2022 held near that peak at 491 deals. The rate-hiking cycle of 2023 produced a pullback to 386 transactions, the only year of genuine deceleration. But the industry found its footing quickly: volume recovered to 402 in 2024, and 2025 returned to 449 deals, signaling the consolidation logic remains intact as financing has normalized. The waste sector does not behave like a cyclical industry in M&A terms. It behaves like an infrastructure-assembly market — steady, directional, and compounding. Investors and operators who interpret the 2023 dip as a cooling thesis are reading it wrong. The thesis — fragmented local markets, aging owner-operators, compelling unit economics at scale — has not changed. What changed temporarily was the cost of capital. The Strategic Logic: Geographic Expansion Above All Else Behind the volume numbers lies a more revealing insight: why these deals are being done. Across the full dataset, geographic expansion or geographic strengthening is the primary deal rationale for 52 percent of all transactions — more than 1,300 deals in six years. No other single rationale comes close. Services expansion accounts for 13 percent, investor buyouts for 11 percent, and technical expertise, customer access, vertical integration, and scale synergies together account for less than 10 percent. The dominant competitive strategy in U.S. waste management is not product differentiation, technology deployment, or vertical integration. It is geographic density — the disciplined, sequential acquisition of local operators to build defensible regional networks too expensive and operationally complex to replicate from scratch. This mirrors the logic that built the large publicly traded waste companies over prior decades. What is different now is that the model has been adopted at scale by mid-market private equity and by a new generation of regional operators executing the same playbook in markets the national platforms have not fully penetrated. The industry is not converging toward a handful of national players. It is consolidating into a tiered structure of regional networks — some PE-backed, some corporate — each defending distinct geographic positions. The Buyer Landscape: Corporates Lead, PE Deepens Corporate acquirers account for 55 percent of all acquirer participations, with PE/buyout firms representing 30 percent. At the top of the corporate league table, GFL Environmental leads all acquirers with 86 transaction participations — a reflection of the company’s aggressive North American roll-up strategy. Waste Connections (56 deals) and Republic Services (55 deals) follow closely. Lakeshore Recycling Systems (41), Wind River Environmental (38), and Waste Pro (38) round out a tier of highly active regional consolidators. The PE landscape is anchored by Kinderhook Industries, which leads all financial sponsors with 73 transaction participations — a remarkable number reflecting a deliberate, high-frequency platform-build strategy. Gryphon Investors (39), Warren Equity Partners (29), Platinum Equity (24), and Aurora Capital Group (23) complete a group that has made waste and environmental services a genuine institutional priority. What makes PE activity particularly notable is its durability. Investor-led buyouts held between 43 and 60 deals per year from 2020 through 2025, even as broader deal markets contracted. Platform strategies — acquiring a foundational business and building density through tuck-ins — proved resilient because the underlying economics are driven by route density and disposal infrastructure, not leverage-dependent financial engineering. The PE firms that have stayed active through the cycle are not simply financial buyers. They are building infrastructure companies. The Sub-Sector Breakdown: Non-Hazardous Dominates, but Complexity Plays Are Growing Non-hazardous waste management is, by volume, the engine of M&A activity — accounting for 54 percent of all deals, or roughly 1,372 transactions. The economics of scale are well understood: denser routes, owned transfer stations and landfills, bundled service contracts. The consolidation logic is straightforward and the transaction velocity reflects it. But the more strategically interesting story is in the adjacent segments. Liquid waste services — septic pumping, grease trap cleaning, hydrovac excavation, sewer line services — produced 551 deals, representing 22 percent of total volume. The liquid waste sub-sector is arguably the most actively consolidated specialty segment in the market, combining geographic density logic with higher service complexity, recurring commercial relationships, and a lack of national competitors. Hazardous waste services generated 468 transactions, with regulatory barriers and technical infrastructure requirements justifying durable consolidation premiums — validated by the $1.178 billion 3E Company acquisition in 2022. Food waste and FOG services represent a smaller but growing share as operators recognize the co-processing economics alongside biosolids and traditional organic streams. The sub-sector mix reveals an industry consolidating across multiple fronts simultaneously — each front driven by distinct
The Last Great Roll-Up in Environmental Services

Why Liquid Waste Stayed Fragmented, and Why Its Consolidation Will Be Won Differently Environmental services has spent three decades consolidating. Solid waste went first: hundreds of family-owned haulers absorbed into national platforms, landfill networks internalized, route systems rationalized. Hazardous waste followed, with permitted treatment capacity concentrating into a handful of operators whose pricing power is now structural. One segment missed every wave. Liquid waste (septage, grease and grit trap service, non-hazardous industrial wastewater, decentralized treatment) remains what solid waste was a generation ago: thousands of local operators, family ownership, relationship-driven books of business, and no national leader. The scale of that fragmentation is easy to underestimate until it is mapped. In a single state, a recent Espalier market study identified more than 34,000 liquid waste-generating facilities, served by 160+ independent septic pumping companies and 75+ treatment and municipal receiving facilities. Across the U.S. East Coast, 6,750+ captive (non-municipal) wastewater treatment plants operate outside the public system, tended by a long tail of 50+ third-party operators, none with dominant share. Meanwhile, the demand side is not shrinking. Aging septic infrastructure, FOG pretreatment enforcement, industrial pretreatment standards, and the steady privatization of treatment services are all expanding the work to be done, even as the supply side remains atomized. The question is not whether liquid waste consolidates. Capital is already circling the segment. The question is why it has not consolidated yet, because the answer determines who wins when it does. The Insight In solid waste, the roll-up was won with balance sheets. In liquid waste, it will be won with visibility. The binding constraint is not capital. It is the ability to see a market that has never been mapped. Every previous consolidation in environmental services ran on legible markets. Solid waste had franchise areas, municipal contracts, and landfill gate volumes. Hazardous waste had the manifest system: a regulatory dataset that told every operator exactly who generated what, in what volume, and where it went. Liquid waste has neither. Its data is scattered across state discharge permits, POTW pretreatment programs, county health departments, and grease trap inspection records: fragmented, inconsistent, and largely unread. Acquirers cannot efficiently consolidate what they cannot see. That is the real reason the segment stayed fragmented, and it is why the consolidation playbook must change. Why Liquid Waste Stayed Fragmented Three structural features have protected the segment’s fragmentation: The consequence: diligence in liquid waste has historically meant trusting a seller’s story. The operators themselves often cannot quantify their own density, their own share, or their own whitespace. Fragmentation persisted not because the segment resists scale, but because scale had no reliable information to build on. What the Last Roll-Up Teaches Solid waste offers the closest precedent, and a measurable one. In 1996, the industry’s top three companies controlled 37% of the U.S. landfill market. By 2021, the top three held 59%. The intervening 25 years, spanning the USA Waste–Waste Management combination, the Republic–Allied merger, and thousands of tuck-in acquisitions, represent the most complete consolidation arc in environmental services. Three lessons from that arc translate directly to liquid waste: There is one more difference, and it favors the disciplined. The solid waste roll-up was executed with paper maps and relationship knowledge. The liquid waste roll-up will happen in an era when 34,000 generators can be mapped, scored, and overlaid against supply in months. The informational advantage that took the solid waste major’s decades to accumulate can now be assembled before the first acquisition closes. Route Density Is the Whole Game If visibility is the entry ticket, density is the prize. Liquid waste is a logistics business wearing an environmental services uniform: trucks, stops, gallons, and gate fees. The cost of serving a customer is dominated by the distance between that customer and a route already being driven. Most operators cannot see their own density. In a recent route-intelligence engagement, Espalier ingested GPS telemetry from just four active trucks in the Northeastern U.S. and mapped the commercial landscape around their existing movements. The result: 50,000+ potential waste generators sat within 1.5 to 3 miles of routes already being driven, and when screened through a physical serviceability framework, more than 80% were feasible to integrate. The pattern repeats at the account level. When a national septic and wastewater operator targeted the quick-service restaurant segment, Espalier mapped 2,000+ locations across two QSR networks and found ownership concentrated among a small set of multi-state franchisees, meaning a handful of relationships could unlock hundreds of stops clustered along existing service areas. Density, it turns out, can be acquired one contract at a time, not only one company at a time. And in Houston, proximity converted a market statistic into a commercial plan: of 2,000+ generators mapped across the MSA, 160+ sites within close range of the client’s facility produced roughly 24 million gallons per year of compatible streams: near-term volume reachable with minimal incremental routing. The New Model The operators and investors moving first in liquid waste are running a different process: one that treats market intelligence as the first investment, not the last diligence item. Intelligence in Action Two recent engagements illustrate the model. For a leading liquid waste management company pursuing growth in Colorado, Espalier built the full market picture: 34,000+ generating facilities segmented by waste type, geography, size, and industry; 75+ competitor and municipal receiving facilities and 160+ septic pumping companies geolocated for supply-side context; and a proximity-based demand–supply overlay identifying where the client held a structural distance advantage over every competitor. The deliverable was not a report. It was an interactive decision-support tool the client’s team uses to evaluate and prioritize opportunities dynamically. For a regional treatment operator in Houston seeking to diversify incoming streams, Espalier sized the industrial wastewater market at 280M+ gallons per year, filtered it to 100M+ gallons of permit-compatible volume across three priority form codes, mapped 2,000+ generators, flagged 160+ near-range sites worth ~24M gallons annually, and benchmarked 14 local treatment providers to expose geographic and capability whitespace. The client’s expansion plan now targets
PFAS Is Now a CERCLA Hazardous Substance — The TSDF Operator’s Playbook
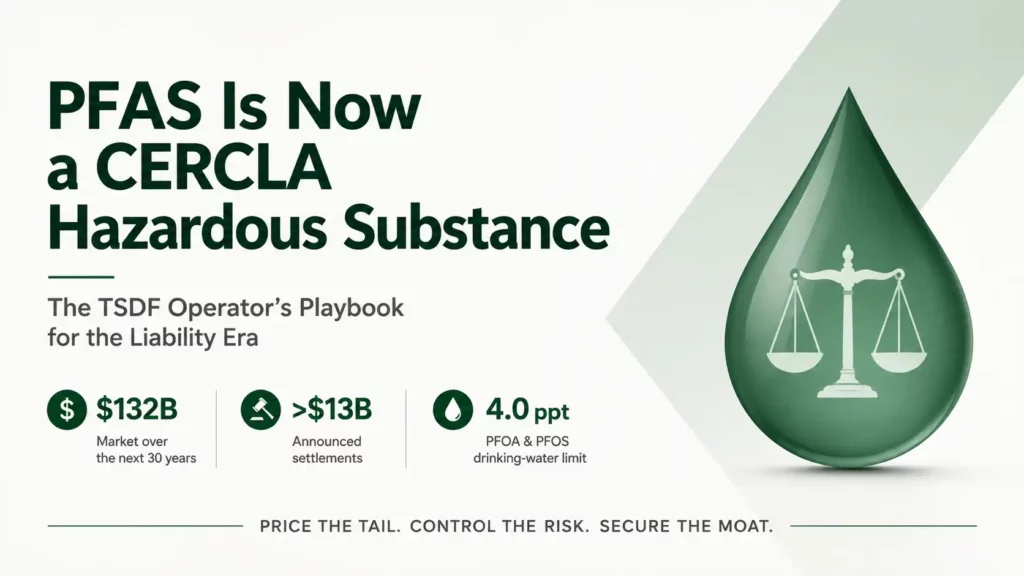
Designation turned every disposal decision into a balance sheet decision. The operators who win the next decade will be the ones who can price a thirty-year liability tail against a near-term revenue surge — and who already hold the permits. WHAT CHANGED, IN THREE NUMBERS $132B — the national PFAS treatment and remediation market over the next thirty years, per the Environmental Business Journal’s 2026 survey: roughly $88B remediation, $24B drinking water, $20B wastewater. Revised down from $230B a year earlier as federal restrictions eased. >$13B — announced settlements with public water systems, across five defendant groups. The personal-injury track has not settled at all. 4.0 ppt — the drinking-water limit for PFOA and PFOS. Unchanged, and forcing thousands of utilities into treatment whose spent media has to be disposed of somewhere. THE PROBLEM The ground under the waste business just moved For thirty years, per- and polyfluoroalkyl substances moved through the waste system as chemistry nobody had to name. They arrived in firefighting foam, plating baths, textile finishes, food-packaging coatings and municipal sludge, and they left as landfill leachate, incinerator ash and spent filter media. There was no reportable quantity, no cleanup standard, no line on the balance sheet. A treatment, storage and disposal facility priced the tip fee, moved the tonnage, and closed the manifest. That model ended on July 8, 2024, when the U.S. Environmental Protection Agency’s designation of PFOA and PFOS as hazardous substances under the Comprehensive Environmental Response, Compensation, and Liability Act — Superfund — took effect. The rule was signed on April 17, 2024, announced two days later, and published in the Federal Register on May 8. For the first time, two of the most widespread PFAS carry the full weight of CERCLA: strict, retroactive, joint-and-several liability, with a one-pound reportable quantity attached. The significance is not that a chemical was added to a list. It is that CERCLA reaches backward. Liability attaches to material a facility accepted years ago, under permits that were valid at the time, at concentrations no one was required to measure. A single documented receipt of PFOA- or PFOS-bearing waste can make an operator a potentially responsible party in a cleanup it did not cause and cannot undo. The obvious question in 2024 was whether the designation would survive a change of administration. It has. On September 17, 2025, EPA — the same agency then actively loosening other PFAS rules — announced it would keep the CERCLA designation for PFOA and PFOS and defend it in court. What has not been answered is the judicial question. The industry challenge, Chamber of Commerce v. EPA (No. 24-1193), was argued before a D.C. Circuit panel on January 20, 2026 and remains undecided; a parallel challenge to the drinking-water standards is pending in the same court. The honest position for an operator is therefore not that this liability is permanent. It is that the political off-ramp has closed, the judicial one is narrow and slow, and no capital allocation decision made between now and the ruling can sensibly assume the designation disappears. THE INSIGHT PFAS stopped being a waste-handling problem and became a balance-sheet problem The instinct across the industry is to treat PFAS as an operational challenge — a question of which technology removes it and at what throughput. That framing misses where the value is actually moving. The CERCLA designation converts every disposal decision into a long-dated financial position: the operator books a tip fee today and absorbs a contingent liability that can surface decades later, denominated in remediation costs and contribution claims. Environmental services is shifting from a disposal business to a liability-underwriting business. The winning operators over the next decade will not be the ones with the most capacity. They will be the ones who can price a thirty-year liability tail against a near-term revenue surge with better information than anyone across the table — and who hold the scarce permits that let them act on that view. What follows is the playbook that shift demands. THE STRUCTURAL SHIFT 1 · Three things the CERCLA designation changes for every TSDF operator Liability now attaches to waste you have already buried CERCLA liability is strict, joint and several, and retroactive. A facility does not have to have been negligent, and it does not get to apportion its share downward at the outset — any potentially responsible party can be pursued for the full cost of a cleanup and left to chase contribution from others. Because the statute reaches backward, the exposure sits in the historical record: every manifest, every profile, every drum of AFFF-impacted media a facility accepted is now a potential anchor for a claim. The waste did not change. Its legal character did. Every transaction and permit now surfaces PFOA and PFOS Designation pulls the two compounds into the machinery that runs off the CERCLA hazardous-substance list. Releases at or above the one-pound reportable quantity must be reported within 24 hours. Less visibly, the designation rewired property diligence. ASTM E1527-21 — the standard EPA recognizes for satisfying “all appropriate inquiries” — treats emerging contaminants as non-scope items only until they are designated under CERCLA; Appendix X6.10 provides that once they are, they must be evaluated within the scope of the practice. PFOA and PFOS crossed that line on July 8, 2024, and EPA confirmed the consequence in its December 2025 Brownfields FAQs. Other PFAS remain non-scope unless a client requests them or a state requires them. The practical exposure runs backward as well as forward: Phase I reports commissioned since mid-2024 that treated all PFAS as non-scope may not support the innocent-landowner or bona fide prospective purchaser defenses they were bought to secure. For an acquisitive operator, this is not a diligence footnote. It is a valuation input on both sides of every deal — and a re-underwriting question on deals already closed. The “passive receiver” carve-out is a policy, not a shield — and TSDFs are not on the list Alongside the rule, EPA issued
The Biggest Risk in Biosolids Isn’t PFAS — It’s Fifty Different Rulebooks
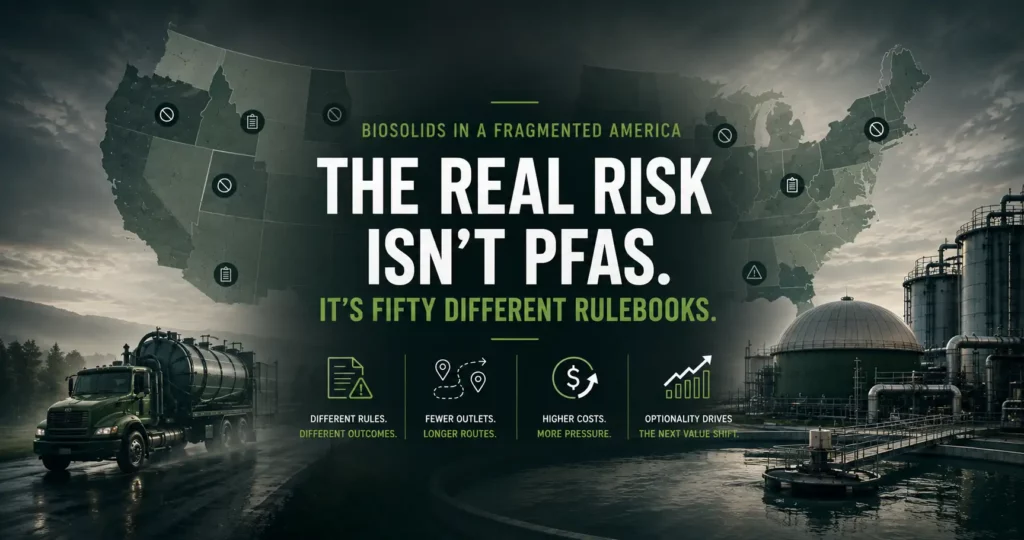
In July 2026 the federal government effectively declined to set a national standard for PFAS in biosolids. That decision hands the rulebook to the states — and turns regulatory geography into the industry’s most important economic variable. THE FRAGMENTATION, IN THREE NUMBERS 20 to 100 ppb — the range of state prohibition thresholds for PFOA and PFOS in land-applied biosolids. Identical material is unrestricted in one state, rate-capped in the second and banned outright in the third. ~60% — the share of U.S. sewage sludge that is land-applied, per EPA. It is the lowest-cost outlet in the system, and it is the one the states are closing state by state. $110.91 vs $62.28 — average landfill tip fee per ton in Maine against the national average. Four years after Maine banned land application, its disposal costs are the second highest in the country. THE PROBLEM Washington just declined to write the rulebook For most of the last two years, the biosolids industry has been waiting on a federal number. In January 2025 EPA published its Draft Sewage Sludge Risk Assessment for PFOA and PFOS, and the sector read it as the opening move toward a national standard. More than 25,000 comments followed. Utilities budgeted against it. State regulators cited it. Operators deferred capital decisions until they could see where the federal line would fall. That line is not coming, at least not soon. On July 1, 2026, EPA released Draft Guidance for Reducing Risk from PFOA and PFOS in Biosolids — a memorandum of non-binding, voluntary recommendations, published for comment through September 4, 2026. In releasing it, the agency distanced itself from its own draft risk assessment, concluding that the earlier work rested on assumptions too disconnected from real-world conditions to give the public actionable information. The guidance sets no federal concentration limit. It recommends source identification, industrial pretreatment and pollution prevention, and it states plainly that it does not have the force of law and cannot be relied on in litigation. The industry has largely filed this as a deregulatory event — federal pressure easing, one more reason to wait. That reading is exactly backwards. A federal standard, whatever its number, would have been a single rulebook. Declining to set one does not remove the rule. It delegates it. And the states have already written their versions. THE INSIGHT Regulatory geography has overtaken treatment technology as the primary economic variable The instinct across the sector is to treat PFAS in biosolids as a technical problem: measure the concentration, select the treatment, price the tonnage. That framing is not wrong, but it is answering a question that has stopped being decisive. Concentration is measurable and treatment is engineerable. What is neither is the fact that the same measured concentration produces a different legal outcome, a different disposal option and a different cost in every state the material can reach. The United States is no longer a single biosolids market operating under a federal framework. It is a set of state markets in which the boundary conditions — what can be applied, where, at what rate, and what has to be trucked somewhere else instead — are set locally and are diverging. For operators and their investors, that shifts the analytical burden. The question is no longer what the material contains. It is where the material is, where it can legally go, and what the route between those two points costs. THE STRUCTURAL SHIFT 1 · What fragmentation actually looks like Descriptions of this market usually stop at “Maine banned it and other states are considering rules. That understates the position considerably. Seven states now have specific, published numeric or categorical positions on PFOA and PFOS in land-applied biosolids, and the numbers do not agree with one another. Read the table as an operator would. A batch of biosolids testing at 60 ppb combined PFOA and PFOS can be land-applied at a reduced rate in Pennsylvania under the proposed general permit. The same material cannot be land-applied at all in Maryland, Virginia or New York. In Michigan it is applied at a reduced rate with source-reduction obligations attached. In Maine it is irrelevant what the number is, because the pathway is closed regardless. One material, one laboratory result, five different commercial outcomes. Note also what the states have converged on structurally even as they diverge numerically. Six have adopted some version of the tiered framework Michigan built in 2021 — prohibit above a ceiling, restrict in a middle band, permit freely below a floor. What they have not adopted is Michigan’s numbers. Michigan prohibits at 100 ppb and Pennsylvania proposes the same; Maryland, Virginia and New York prohibit at half that. A five-fold spread in the effective floor sits between states that all believe they are following the same model. Two features of the newer statutes deserve more attention than they have had. Both Maryland and Virginia explicitly permit blending material from different treatment works to bring combined concentrations under the threshold. That is a legal arbitrage, and it is available only to operators with enough throughput across enough sources to blend. And Virginia’s prohibition runs on a rolling twelve-month average rather than a single sample, which converts compliance from a testing event into a portfolio management problem. Neither provision is a technicality. Each rewards scale and data, and neither has anything to do with treatment performance. 2 · Maine is the natural experiment, and it has now run for four years The value of Maine is that it removes the speculation. The state banned the land application, sale and distribution of sludge and sludge-derived products in August 2022, regardless of PFAS concentration. Four years of consequences are now on the record, and they follow a sequence that any state tightening its rules should expect to repeat in compressed form. The first effect was the collapse of optionality. Maine POTWs were left with landfilling as the only in-state pathway, and in practice with one landfill: the state-owned Juniper Ridge, operated
After Maine: How PFAS Is Reshaping Wastewater Economics
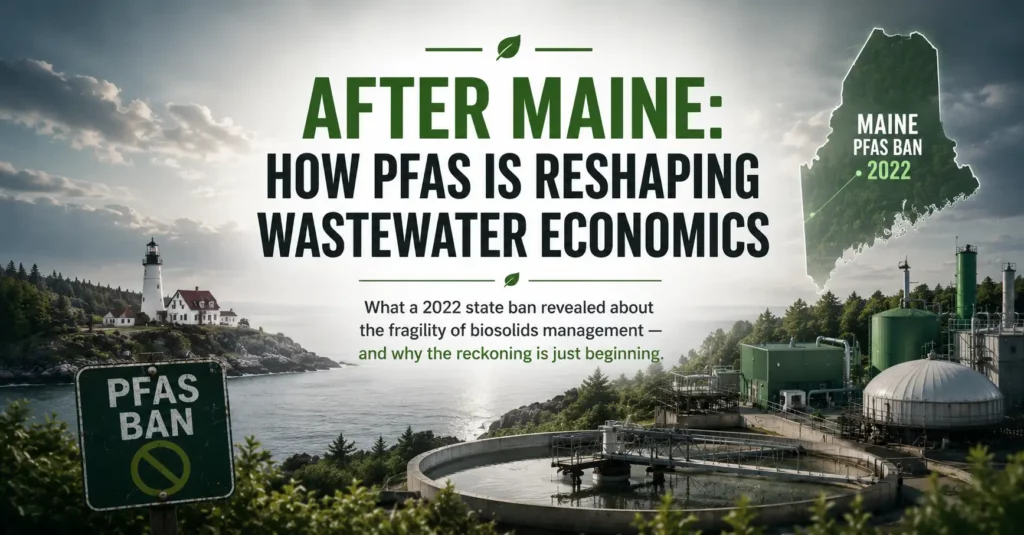
What a 2022 state ban revealed about the fragility of biosolids management — and why the reckoning is just beginning On a July morning in 2022, a truck carrying sewage sludge from a Maine wastewater plant pulled up to the Juniper Ridge landfill — and was told it would have to wait. Biosolids require mixing with dry bulking material at a 5-to-1 ratio or greater before they are stable enough for landfill cells, and the facility needed time to ensure that material was ready. The Portland Water District eventually secured a disposal arrangement, but Scott Firmin, the District’s general manager, told Inside Climate News that his trucks were now “limited to a seven-hour disposal window, six days a week.” That constraint — not a regulation, not a technology gap, but a bulking material logistics problem — became the operational reality for utilities across Maine after the state’s outright ban on land application of biosolids took effect. What unfolded there is being studied closely by operators and capital allocators in states from Maryland to Minnesota — not because Maine is a large biosolids market, but because it showed exactly how PFAS regulation disrupts: by eliminating the dominant disposal pathway before any viable replacement exists and leaving utilities to absorb the cost difference in real time. Portland sued chemical manufacturers in 2024 citing disposal costs that had doubled — $362 million over three years. The state passed emergency legislation to allow out-of-state bulking material. Biosolids were shipped to Canada. A private operator announced a $37 million drying facility. None of this was coordinated. All of it was expensive. Maine is not an anomaly. It is a field study in what happens when PFAS regulation moves faster than infrastructure. More than ten states now actively regulate PFAS in biosolids. The pattern is similar in each: restrictions arrive through legislation, utilities scramble for alternatives, and costs climb while the volume of material keeps arriving at the plant every day. The Regulatory Map Is Being Redrawn State by State The absence of a federal PFAS standard for biosolids is not simply an oversight — it reflects how slowly regulatory frameworks move when the science on a contaminant is still developing and the legal mandate to act lacks a hard deadline. When the EPA finalized the Part 503 rule in 1993, it set limits for nine heavy metals and pathogen controls based on the science available at the time. PFAS were not a regulatory priority anywhere in 1993. What makes the subsequent three decades harder to account for is that the Clean Water Act requires the EPA to conduct a biennial review of biosolids regulations to identify additional toxic pollutants and propose new rules if the evidence warrants it. The agency has conducted nine sewage sludge surveys between 2004 and 2021, and three national surveys going back to 1988. PFAS appeared in the data. The Part 503 rule was not updated. In 2002, the National Research Council reviewed Part 503 standards at EPA’s own request and found no documented evidence that the rule had failed to protect public health, but noted significant scientific uncertainty remained. No amendments followed. By 2024, that inaction had become the subject of litigation — the advocacy group Public Employees for Environmental Responsibility sued, arguing EPA’s failure to regulate PFAS in biosolids violated the Clean Water Act’s non-discretionary mandate. In October 2025, a federal court dismissed the case, finding that while the biennial review obligation exists, the law does not require the agency to regulate within any timeframe. It was only in January 2025 that the EPA released a Draft Sewage Sludge Risk Assessment for PFOA and PFOS — the procedural step the Clean Water Act requires before any binding rule can be proposed. The findings were notable: potential health risks modeled at concentrations as low as 1 part per billion under land application scenarios, a level many current biosolids streams already exceed. In June 2026, the agency followed with draft voluntary guidance on managing PFOA and PFOS risk in biosolids — open for public comment through September 4, 2026, but carrying no binding force. That is where the federal process stands. In the meantime, states have been writing their own frameworks. How states are regulating PFAS in biosolids — a spectrum from monitoring to full ban Figure 1 REGULATORY Landscape – A spectrum from monitoring to full ban — 10+ states now have active regulations, no two identical Sources: ECOS State Review (2022); MOST Policy Initiative (2025); Rockefeller Institute PFAS Policy Dashboard (2026). Classifications reflect laws or binding regulations in effect as of July 2026. This fragmentation creates a specific operational problem. An operator serving generators across multiple states must navigate four different compliance regimes simultaneously — different testing cadences, different thresholds, different required responses when those thresholds are exceeded. And because federal action has been slow to materialize, that fragmentation is likely to deepen before it resolves. Key milestones in PFAS biosolids regulation — from first state action to current federal process Figure 2 Regulatory Trajectory – Key milestones in PFAS biosolids regulation — 2019 to 2026 Source: EPA Federal Register; state DEP records; Rockefeller Institute PFAS Dashboard (2026). What operators are navigating today is not regulatory uncertainty. It is regulatory sequencing — the outcome is increasingly legible, only the timeline is still being negotiated. A processing facility built today will operate for 20 to 30 years. A long-term hauling contract signed this year extends through a regulatory environment that will look materially different by 2030. The operators making infrastructure bets now are implicitly choosing which side of that transition they want to be on. Why the Landfill Route Does Not Solve the Problem When land application becomes restricted, the instinctive fallback is landfill disposal. Maine tested this assumption at scale. The state had to pass emergency legislation to allow imports of out-of-state construction debris just to keep the landfills running — because the shortage of bulking material, not landfill capacity itself, became the binding constraint. That supply chain