The next frontier in liquid waste is not operational, it is systemic
The liquid waste management industry spans UCO, grease traps, grit traps, jetting, plumbing, oily water, and industrial wastewater. Historically, operators have managed it as a route-based services business. They optimized trucks, routes, depots, and customer contracts at the local level.
That model is now reaching its limits.
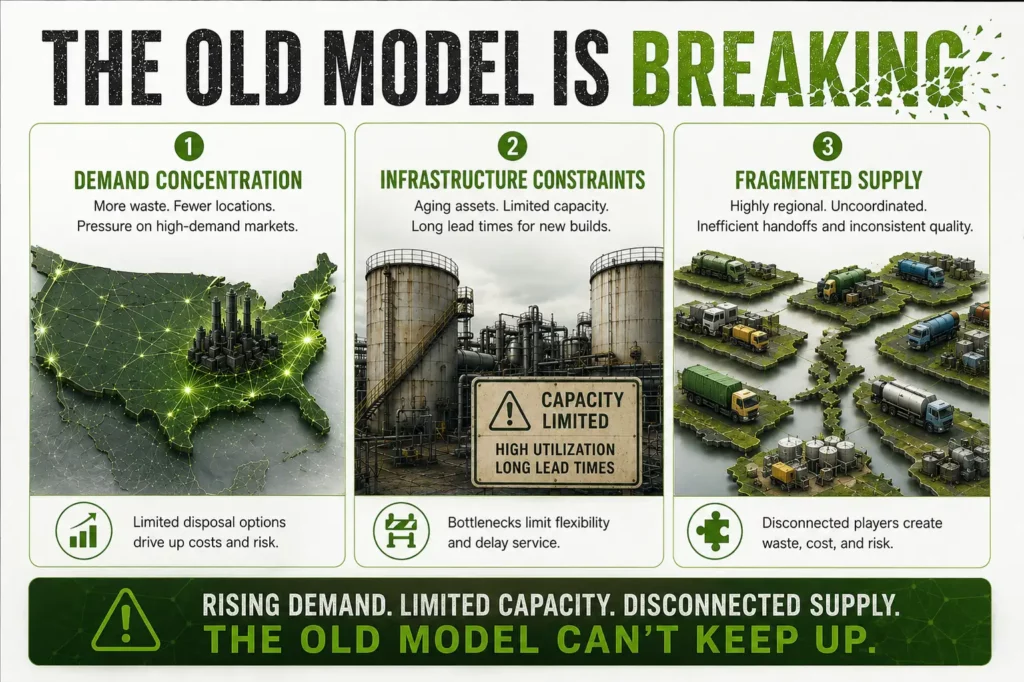
Across the US, the sector is undergoing a structural shift driven by three forces:
- Demand concentration: Waste generation is highly clustered in urban corridors and industrial zones
- Infrastructure constraints: Disposal outlets (Type V, POTWs, recycling) are finite and unevenly distributed
- Fragmented supply: Thousands of sub-scale operators with localized footprints
The implication is clear: Value is no longer created at the route level—it is created at the network level.

Yet most operators still manage the business through disconnected levers: sales, pricing, operations, and M&A. Without a unified decision system, growth becomes inefficient, margins leak, and capital is misallocated.
The result: suboptimal growth, margin leakage and misallocated capital.
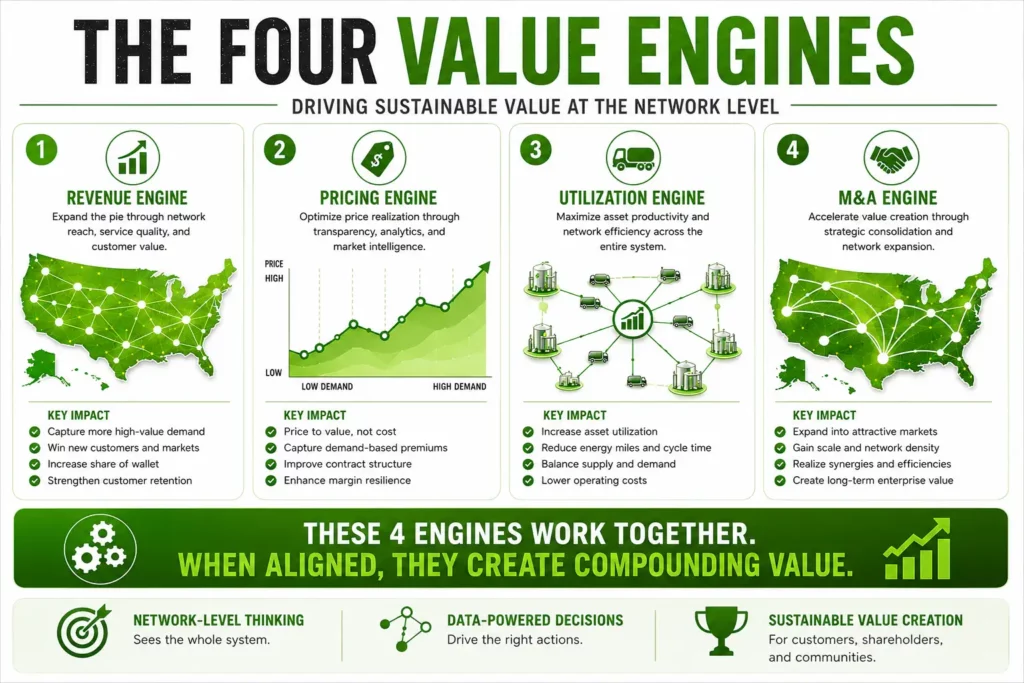
The four strategic engines of value creation
Leading operators are now reorganizing their businesses around four integrated value engines:
- Revenue acceleration
- Pricing optimization
- Asset utilization
- M&A strategy
Together, these engines shift the business from local route management to network-driven value creation.
1. Revenue Acceleration: From reactive service to demand capture
Core issue: Growth is constrained not by market size but by visibility into demand and conversion ability.
- Operators lack granular visibility into generator-level demand (who, where, how much, what type)
- Sales remains relationship-driven rather than data-driven targeting
- Cross-sell across services (e.g., grease + jetting + plumbing) is under penetrated
What differentiates leaders:
- Mapping demand at the site-level across industries and geographies
- Building structured funnels: AQL → MQL → SQL
- Driving route-adjacent acquisition, not random account wins
Impact: 10–15% revenue uplift without adding assets—purely from better demand capture.
2. Pricing: From static rates to market-aligned yield optimization
Core issue: Pricing remains blunt—often cost-plus or legacy-based—while the market is highly dynamic.
- Significant price dispersion across similar customers
- Weak linkage between pricing and route economics
- Limited understanding of elasticity and competitive positioning
What differentiates leaders:
- Pricing linked to proximity, service complexity, and disposal economics
- Dynamic benchmarking vs local competitors and alternatives
- Integration of pricing with routing and asset utilizatio
Impact: 5–10% pricing uplift with minimal churn, and improved margin consistency
3. Asset Utilization: From fleet efficiency to network efficiency
Core issue: Operators optimize trucks—but not the system.
- Suboptimal route density → high cost per stop
- Deadhead miles due to fragmented coverage
- Underutilized disposal optionality
What differentiates leaders:
- Designing contiguous service corridors, not isolated routes
- Integrating routing with demand density and disposal locations
- Treating assets (fleet + outlets) as part of a network graph
Impact: 20–30% improvement in route efficiency and asset productivity
4. M&A: From opportunistic deals to network design
This is where the industry is most misunderstood—and where the largest value pools exist.
Deep Dive: M&A as a Network Strategy, Not a Deal Strategy

The problem with traditional M&A in liquid waste
Most M&A strategies in the sector follow a familiar pattern:
- Broker-led processes
- Opportunistic acquisitions
- Financial screening (revenue, EBITDA, growth)
- Limited integration planning
This approach consistently misses value because it ignores the core economic driver of the business: network effects.
What the data actually shows
From our analysis, for a major operator:
- Only ~33% of addressable demand is covered, leaving 67% as whitespace opportunity
- Demand is highly concentrated in a few corridors, not evenly distributed
- Supply is deeply fragmented, with hundreds of local operators and service providers
This creates a structural opportunity: Selective acquisitions can disproportionately improve coverage, density, and pricing power.
In fact, targeted M&A can increase coverage from 33% → 51% with a limited set of acquisitions
Reframing M&A: From “Which company?” to “What network outcome?”
The right starting point is not the target—it is the network gap.
Step 1: Build full market visibility
- Map all generators (e.g., restaurants, industrials, energy facilities)
- Overlay waste volumes, types, and frequency
- Identify high-density demand corridors
(Example: 370K+ generators mapped in Texas with volume and location granularity )
Step 2: Overlay supply and infrastructure
- Operator footprints (depots, routes)
- Disposal infrastructure (Type V, POTWs, recycling)
- Permit and regulatory constraints
This creates a unified view of demand × supply × infrastructure
Step 3: Apply network filters (the real drivers of value)
From the LES framework (page 13): ~90% of M&A value is driven by network economics
Key drivers:
- Route density impact (25%) → lowers cost per stop
- Demand alignment (20%) → ensures real volume capture
- Outlet access (20%) → drives pricing power
- Proximity to network (15%) → accelerates integration
This fundamentally changes how targets are evaluated.
The three types of high-value acquisitions
Every target should be classified based on its role in the network:
1. Density Plays (route economics)
- Fill gaps in high-density corridors
- Increase stops per route
- Reduce deadhead miles
Outcome: Immediate cost and margin improvement
2. Outlet Plays (margin control)
- Add or secure disposal capacity
- Reduce reliance on third-party outlets
- Improve pricing flexibility
Outcome: Structural margin expansion
3. Capability Plays (service expansion)
- Add services (e.g., oily water, industrial cleaning)
- Expand into adjacent verticals
- Enable cross-sell
Outcome: Revenue growth + wallet share expansion
From long list to actionable targets
A systematic approach narrows the universe:
- Start with full market (all operators)
- Apply network filters → identify relevant geographies
- Apply strategic filters → ownership, deal readiness
- Rank and segment into:
- Tier 1 (10–15 targets): immediate acquisitions
- Tier 2 (20–30): strategic pipeline
- Tier 3: monitor

Why this approach wins
Traditional M&A answers: “Is this a good company?”
Network-driven M&A answers: “Does this asset improve our system?”
That distinction is decisive.
Because in liquid waste:
- Value is created through adjacency, not scale alone
- Integration is operational, not financial
- Synergies are spatial (routes, outlets), not just cost-based
The integration advantage (where most value is lost)
Even when deals are well-selected, value is often lost post-close.
A network-driven approach solves this upfront:
- Integration is pre-modeled through route adjacency and demand overlap
- Synergies are quantified in terms of density, pricing, and utilization
- Execution is aligned to operating teams, not just corporate development
From episodic M&A to a continuous system
The end-state is not a better pipeline—it is a different operating model.
As outlined in the LES framework:
- M&A becomes a continuous, always-on system
- Integrated across:
- Origination
- Prioritization
- Diligence
- Integration
This transforms M&A from a periodic activity into a core growth engine.
What this means for operators and sponsors
For operators
- Stop viewing M&A as expansion
- Start viewing it as network design
For private equity
- Move from deal sourcing to systematic origination
- Underwrite based on network impact, not just EBITDA
For management teams
- Align commercial, operations, and M&A under a single decision layer
- Measure success through:
- Coverage
- Density
- Outlet control
- Yield per route
What comes next
This is the first in a series.
If M&A is the structural lever, then:
- Revenue Acceleration is the demand engine
- Pricing is the yield engine
- Asset Utilization is the efficiency engine
Each will be explored in depth in subsequent articles.
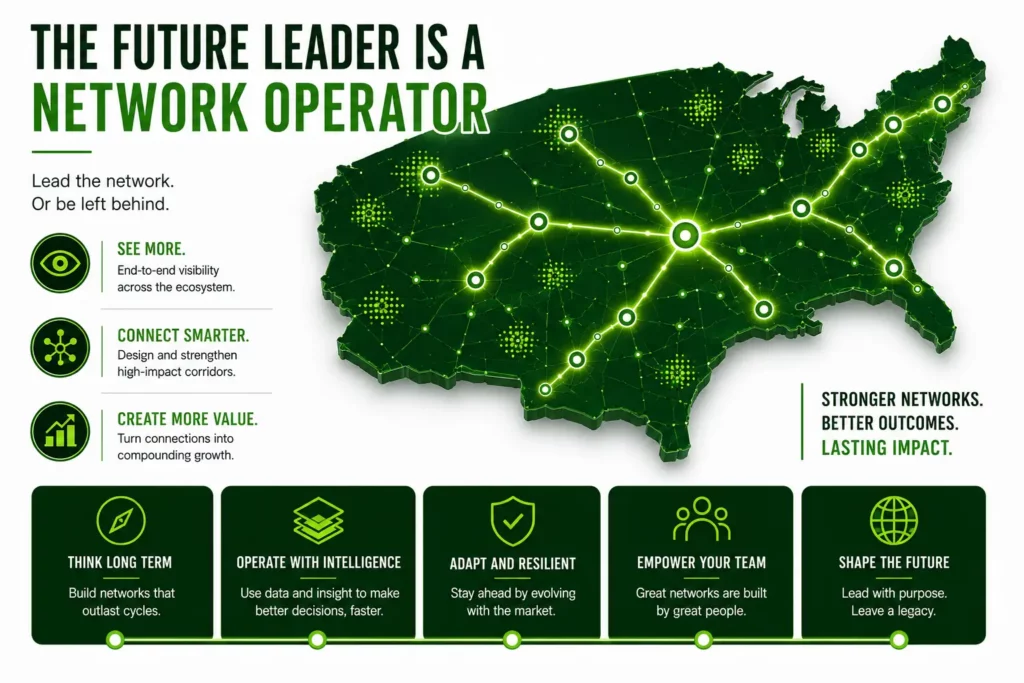
Bottom line
The liquid waste industry is not a services business—it is a network optimization problem.
Those who continue to operate locally will remain subscale.
Those who build decision systems across demand, pricing, assets, and M&A will define the next generation of leaders.