
Demand, supply, assets, permits, ownership, technology and signals are connected entities. Every artifact in a transaction flattens them into prose and a single number, and the flattening is where the information dies. The thirty-interview market study is not the problem — it is what you produce when there is no graph underneath you.
A market has a shape, and it is not a page
A waste market is not a number. It is tens of thousands of generating sites producing particular streams at particular volumes and prices; a few thousand operators with trucks, permits and processing assets; contracts connecting the two; disposal and reuse outlets at the end of every route; owners above the operators; and a continuous stream of filings that tells you when any of it changes.
What matters commercially is not the entities but the edges between them — which generator is served by which hauler, into which facility, at what haul distance, under what contract, at what price. Density economics live on the edges. So does whitespace, and so does acquisition logic.
Every artifact in a transaction flattens that structure. The market study renders it as a paragraph and a growth rate, the CIM as a share estimate against a total, the IC memo as a sensitivity table. Each flattening is lossy and none is reversible: you cannot get the sites back out of the TAM.
The question is not whether the market can be described. It is whether the description can be interrogated. A number can only be believed or disbelieved. A graph can be traversed, filtered, disputed and corrected — which is what underwriting actually requires.
One market, seven builds, no shared object
The cost of having no persistent object shows up in how often the market gets rebuilt. Between mandate and exit, a mid-market platform’s market is built from scratch seven or eight times, by parties who cannot reconcile their work to each other.
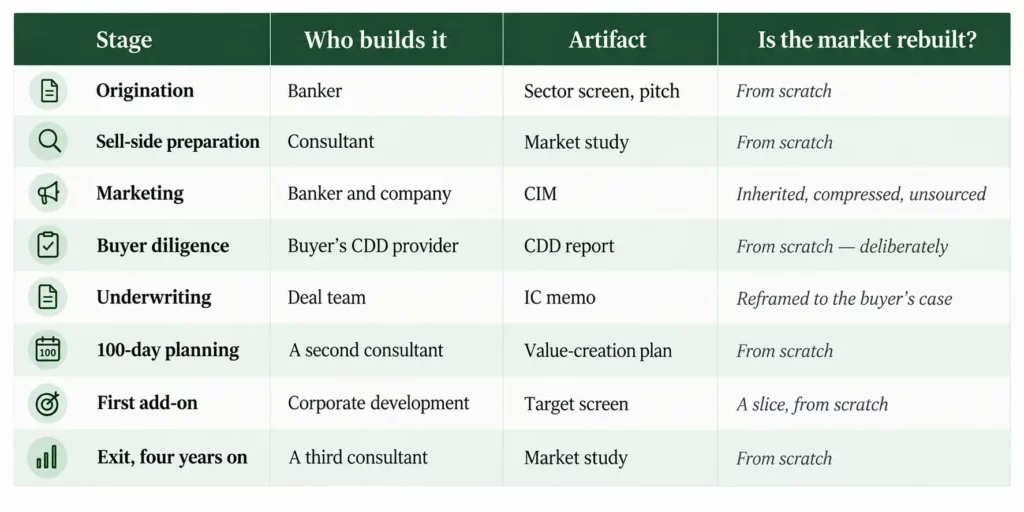
The market did not change seven times. The representation of it did. None of this is a criticism of the people doing the work — with nothing structured to inherit, starting over is the rational choice. The architecture is the problem, not the practitioners inside it.
What sits underneath: eight layers, one graph
The alternative to a study is not a better study. It is a persistent entity graph that the study, the CIM, the diligence pack and the value-creation plan all read from.
“Graph” is only a useful word if the schema is specific, so here is ours. Eight layers, each populated from named sources, each carrying an explicit confidence tier — Observed for filed or identified records, Modelled for figures derived from observed inputs under a stated assumption, Strategic for anything requiring capex, acquisition or capability that does not yet exist.
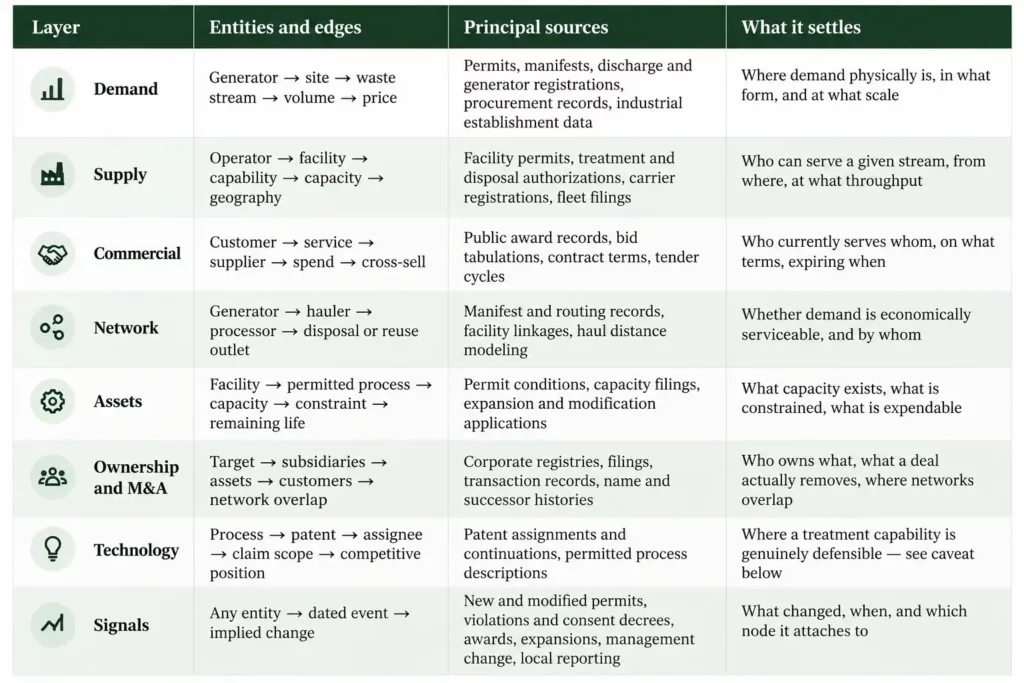
Two layers deserve honesty rather than promotion. Patents are load-bearing in treatment and technology-differentiated assets and close to irrelevant in route-based collection, where defensibility is density and permits; the layer earns its place in perhaps one build in four. Signals are the noisiest: a new permit application is a real event, a local news item usually is not, and the discipline is in what gets attached to a node rather than in how much gets ingested.
The value is in the edges, and the edges are what nobody has
Anyone can download a facility list. Public records are free and have been for years, which is the obvious objection to all of this: if the data is available, why has the method not already displaced the convention?
Because records arrive as disconnected nodes. Nothing in them says which generator ships to which processor, or which of four legal entities is one operating company. The same business appears as three entities in a state license file, under a trade name in the carrier registry, under an acquired name in a permit file nobody updated after the deal, and under the parent in procurement records. There is no common key.
Building the graph is therefore mostly resolution, not acquisition — companies to operating entities, entities to sites, sites to streams, streams to volumes, volumes to prices, customers to the suppliers actually serving them. Each of those is an edge, and each edge is inferred, evidenced and tiered rather than found.
That economics makes the graph a firm-level asset rather than a project deliverable: largely a fixed cost, incurred once per vertical and amortized across every subsequent build in it. It is also why this arrives through specialists rather than as a feature of the incumbent model.
The thirty-interview study is what you produce when there is no graph
Set the graph aside and look at how a market gets sized today. The methodology page tells you: twenty-five, thirty or forty interviews with customers, competitors and industry experts, supported by industry reports and public sources. It is usually page four, and almost never read.
Read it on the next three studies that cross your desk and count. Then ask one question: if four of those thirty conversations had gone to four different people, what would the market size in the executive summary be? Nobody can answer that. That is the finding.
This was not lazy — it was correct. Twenty years ago competitors disclosed little, government records sat in county offices and scanned PDFs, and operating data had no common identifier. Assembling a graph cost more than it was worth. That condition no longer holds: the EPA’s ECHO Exporter alone publishes summary records for more than 1.5 million regulated facilities across 130-plus fields, refreshed weekly, with coordinates where available.
One caution, because it demonstrates the discipline the graph is built on. That figure is the ECHO Exporter registry file; the EPA describes ECHO’s integrated compliance history as covering roughly 800,000 facilities. The two answer different questions, and a study citing the larger to support a claim only the smaller carries will be found out. At graph scale, an unresolved distinction like that propagates into every edge built on it.
The graph does not replace the interview. It changes the question
A capable industry executive can tell you things no record holds — why an account moved, where pricing is going, which competitor is quietly bidding below cost. That is causation and intent, the scarcest input in the process. But establishing what is there is a different task from explaining why.
The conventional opening question is “who are the major competitors?” Ours is: “the graph holds 214 operators in this footprint. Which are the same company under two names, which are not really in this business, and who is missing?” The first spends an expert’s forty-five minutes on recall, which is what they are worst at. The second spends it on judgment, and returns their answers to the graph as corrections rather than as quotes in an appendix. Better evidence does not make expert judgment cheaper. It makes it worth more, and it makes it durable.
On the sell-side, the test is not accuracy. It is falsifiability
A sell-side market claim does not need to be right in the abstract. It needs to survive a buyer trying to break it, and those are different standards. Evidence matters more than plausibility, and the gap between them is where value leaks.
Consider the sentence in almost every CIM: the company holds a low-single-digit share of a large, fragmented and growing addressable market. The buyer asks the only question that matters. Show me the denominator.
The traditional answer — a third-party report, management estimates, a triangulation of interviews — cannot be checked, only disputed. With no shared object to resolve against, the buyer settles it the only way available: a discount, applied quietly, inside the model, never raised in a meeting. The seller never learns it happened.
A graph answers by traversal. Here are the generators, named and located; their streams and volumes, with the basis for each estimate; the operators and assets serving them, and the haul economics that decide who can; and the reachable demand the company does not serve. The buyer can filter that, argue that eleven sites are out of scope and four are double-counted, and hand it back. That is a better outcome for a seller than agreement: a number that has survived a serious attempt to break it prices differently from one nobody could examine.
The document becomes the interface. The graph is the evidence layer
None of this means the CIM disappears, or the market study, or the IC memo. Documents are how a case gets argued, and a well-argued case still wins processes. What changes is what sits beneath them, and what happens at the handoff.
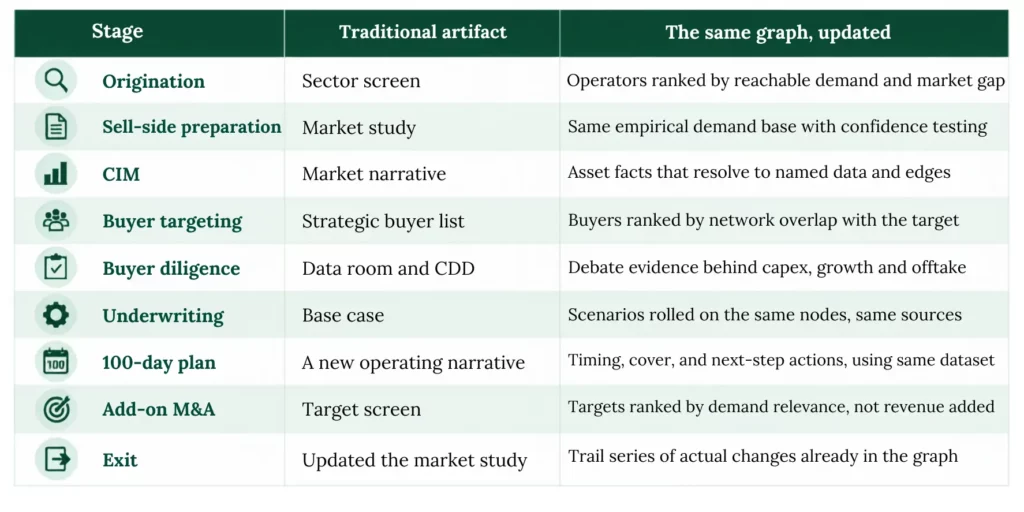
Every assertion in the presentation resolves to a section of the evidence book; every section to a query against the graph; every query to the underlying records. One claim at three resolutions, so a chief executive, a diligence analyst and a data scientist each read it at the depth they need.
From a study that ends to a graph that persists
The shift is a change in the order of operations, and in what survives it.
The conventional sequence: Define → Interview → Infer → Triangulate → Estimate → Archive → Rebuild.
The graph-led sequence: Observe → Resolve → Connect → Tier → Estimate the residual → Interview → Correct → Refresh.
Judgment does not disappear from the second sequence and should not. Private markets contain incomplete registers, ambiguous boundaries, unfiled changes and facts only long-serving operators hold. The objective is to make clear where judgment begins — so a buyer can price it rather than guess at it, and so the next party inherits it rather than reconstructing it.
A study produces an answer and throws away the working. A graph keeps the working, so the next answer is faster and the one after that is better. Twenty years ago, thirty well-chosen interviews were the best available evidence about an opaque private market. Today they are the most expensive way to produce the least checkable answer — and the only one that has to be produced again from scratch by everybody who comes next.