Regulation creates the ton. Feedstock decides what it is worth. As mandates reach smaller, more dispersed generators, advantage will go to those who underwrite feedstock cohorts — not tonnage.
Our last piece showed that regulated tons and economically addressable tons are not the same number. This one goes a level deeper. Even once a ton is addressable, its value depends on what it is. A brewery’s wash water, a pallet of expired packaged yogurt, a restaurant’s plate scrapings and a grease-trap pump-out all enter the market as “food waste.” They need different trucks, different preprocessing and different digesters. They command different gate fees and produce different outputs. On a scale, they are identical. On a P&L, they are different businesses.
The ton is an accounting unit. The feedstock is the economic unit. Capital allocated on the first — site selection, capacity sizing, acquisition valuation — is routinely mispriced on the second.
Headline tonnage conceals the mix that drives value
EPA’s final anaerobic digestion survey makes the point with its own data. Respondents processed 16.0 million tons of food waste in 2022 — but 14.7 million tons of it was beverage-processing waste, much of it at digesters co-located with breweries. Strip it out and the national total falls to 1.36 million tons. In 2023, reported volume fell to 7.7 million tons while the non-beverage figure barely moved, at 1.43 million. The headline halved; the rest of the market was essentially flat.
Part of the distortion is physics. EPA converts beverage waste at the density of water, 8.34 pounds per gallon, against 3.8 pounds for source-separated organics. The same gallon becomes 2.2 times the tonnage. Any market sizing, capacity plan or valuation built on undifferentiated tons inherits that error.

Regulation is adding the hardest tons last
The next wave of mandates will not add more of the same ton. New York’s law, which today covers generators of two tons per week within 25 miles of an organics recycler, drops to one ton and a 50-mile radius in January 2027, and to half a ton in 2029. Each step pulls in smaller, more dispersed generators — lower stop density, more packaging, more contamination, longer hauls.
Massachusetts shows why incremental regulation does not guarantee incremental tons. Diversion reached 380,000 tons in 2023, up from roughly 100,000 before the 2014 ban. But when the threshold fell to half a ton in 2022, processors saw less growth than anticipated — many newly covered generators were already diverting. MassDEP estimates the current ban alone gets the state to roughly 400,000 tons against a 2030 goal of 780,000. The remainder must come from smaller commercial and residential sources: precisely the feedstock with the weakest unit economics.
Tellingly, New York’s regulator already reasons at the feedstock-and-capacity level. A generator’s obligation applies only to the extent a recycler within range has capacity to accept its scraps, based on DEC’s annual capacity estimate. When the agency models feedstock against capacity, an investor underwriting on tonnage is working with less information than the regulator.
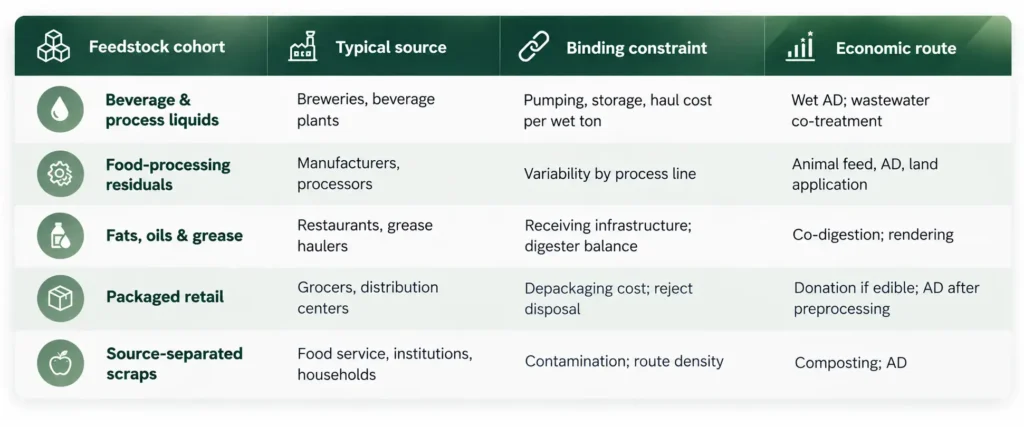
Food waste is a portfolio of feedstocks, each with its own economics
Physical characteristics set the route. High-moisture beverage and process liquids suit wet digesters. Fats, oils and grease are energy-dense co-digestion feedstocks that demand dedicated receiving. Packaged retail material is worth little until it is depackaged, and the rejects cost money to landfill. Source-separated scraps go to compost or digestion depending on contamination and local outlets.
Given the chance, the market re-routes tons toward the best-paying outlet. In Massachusetts, food waste sent to digestion rose from about 48,000 tons in 2016 to 239,000 in 2023, while composting fell from roughly 80,000 to 26,000. Same regulation, same state — the feedstock followed the economics.
There is no price per ton — only net value per delivered ton
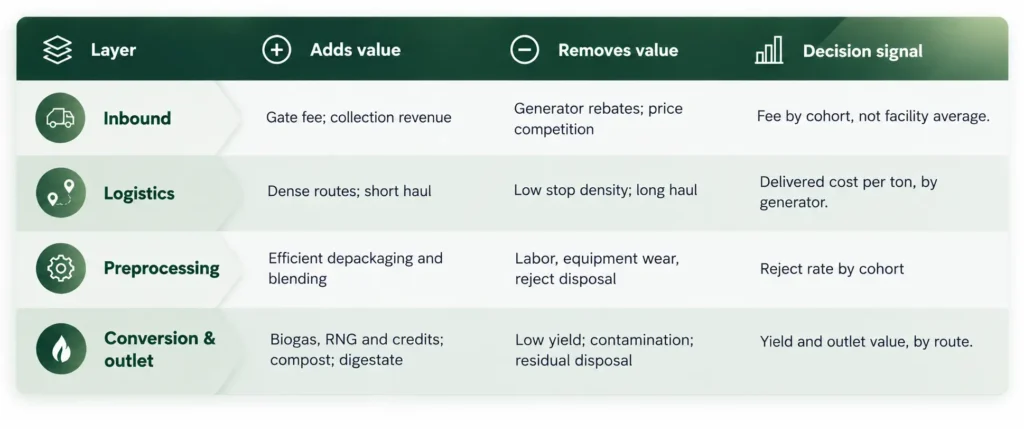
Food waste does not clear at a single market price. Of 60 digesters in EPA’s survey, 80% collect tipping fees; among the 18 disclosing them, the 2023 median was $22.23 per ton and the mean $32.27. The spread is more telling than the average. Facilities price by feedstock — higher when material needs depackaging, charging grease haulers but not source-separated food-waste haulers, or charging for food waste but not manure.
The gate fee is only the first line. As the first article in this series described, the full revenue stack runs through RNG, environmental credits and digestate — and every layer is feedstock-dependent. The metric that matters is net value per delivered ton: gate fee plus output value, less haul, preprocessing, rejects and conversion cost. Two tons at the same gate fee can sit on opposite sides of break-even.
Nameplate capacity is not feedstock capacity
The same logic applies on the supply side. EPA found that 55% of 44 responding digesters had spare capacity for off-site feedstock, but cautioned that usable capacity depends on proximity, preprocessing, co-feedstock availability and the optimal blend. A digester with idle nameplate can still be unable to take the next available ton profitably — too far, too dry, too packaged or wrong for the blend. Capacity is a property of a facility and a feedstock together, not of a facility alone.
Decision intelligence turns the feedstock into an underwritable asset
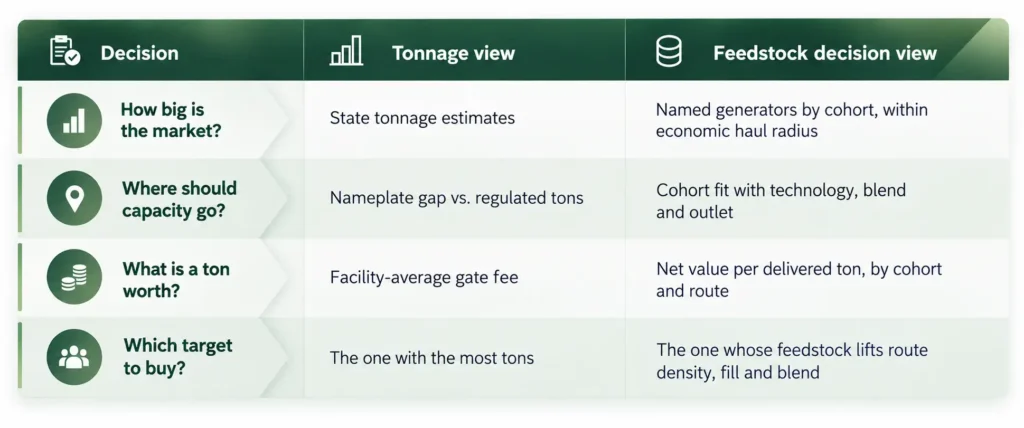
If value lives at the feedstock level, decisions must be made there — and that requires a system, not a spreadsheet of state tonnage estimates. A decision intelligence layer for organics does three things. It resolves the market to named generators, classified into feedstock cohorts from public regulatory data — designated-generator lists, permits, facility filings and capacity estimates. It prices each cohort by route, computing net value per delivered ton from haul distance, preprocessing burden, gate economics and outlet value. It refreshes as thresholds ratchet, so New York’s 2027 and 2029 tranches are modeled generator by generator before they arrive.
The payoff is sharpest in underwriting. 50,000 tons of clean industrial liquid a short haul from a wet digester can be worth more than 75,000 tons of fragmented packaged retail requiring long hauls and heavy preprocessing — a difference invisible in a tonnage model and obvious in a feedstock one. The same shift reframes capacity siting, pricing and M&A.
The window is narrowing. EPA’s 2024 digester survey was the last in its series. As public benchmarks thin out just as mandates reach the most heterogeneous generators, the information advantage shifts to whoever builds the feedstock view themselves.
THE ESPALIER VIEW
The unit of analysis in organics is moving from the ton to the feedstock cohort. Regulation determines how many tons enter the system; feedstock determines which of them create margin. That distinction is computable — generator by generator, cohort by cohort, route by route — before a truck is dispatched or a dollar is committed. It is the difference between buying volume and buying value.
THE BOTTOM LINE
Regulation creates the ton. Feedstock economics determine what it is worth. As mandates reach smaller and messier generators, volume growth and value growth will diverge — and the operators and investors who see that divergence first, at generator-level resolution, will capture the spread.