
Market share divides a company’s revenue by every dollar of spend in its sector, including the dollars it could never economically serve. In route-based businesses the denominator that matters is set by fixed nodes, drive time and permits. Measured against it, two platforms with identical market share can be opposite businesses. Network share is the first measure in this series that cannot be computed without the graph.
Market share divides by demand the company could never serve
The previous piece set out where record-based evidence stops. This one begins the case for what sits inside that boundary, starting with a measure that cannot be built any other way.
Almost every growth case in environmental services opens with the same ratio: company revenue over total market spend. A platform earning $60 million in a region with $2 billion of recorded spend holds 3%, and the other 97% becomes the runway. In a route business both terms are wrong. The denominator counts demand hundreds of miles from any facility the company owns that could accept it. The numerator treats an account held because no one else can reach it the same as one held against three competitors. The ratio is precise, and it describes nothing a buyer can underwrite.
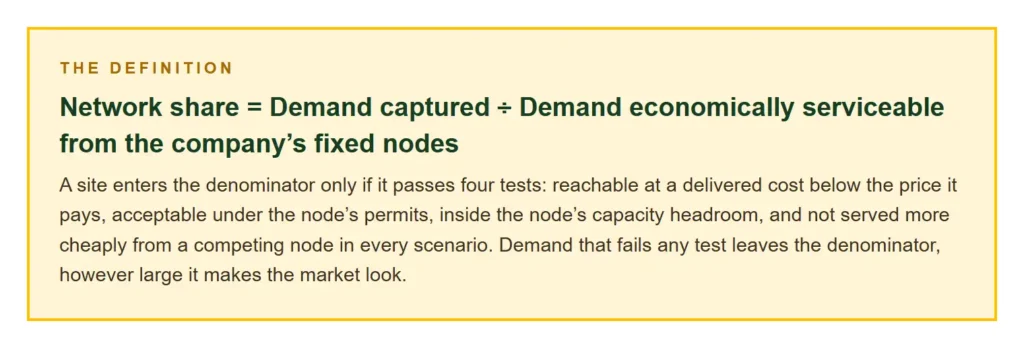
Network share replaces both terms. It is the share of economically serviceable demand that the company actually captures, where serviceable means within economic reach of the company’s own fixed nodes, acceptable under their permits and inside their capacity. The denominator is a set of named sites, not a sector total. That is why it can only be computed from the graph described in Piece 1: the demand layer resolved to sites and streams, the network layer to who serves whom, the assets layer to which outlets can take what.
The scarce asset is the fixed node, not the truck
A truck can be bought, leased or subcontracted in weeks. A permitted treatment plant, transfer station or disposal outlet takes years to site and permit, and often faces local opposition at every step. Routes radiate from nodes; nodes do not follow routes. Whoever controls the node in a geography sets the cost floor that everyone else there competes against.
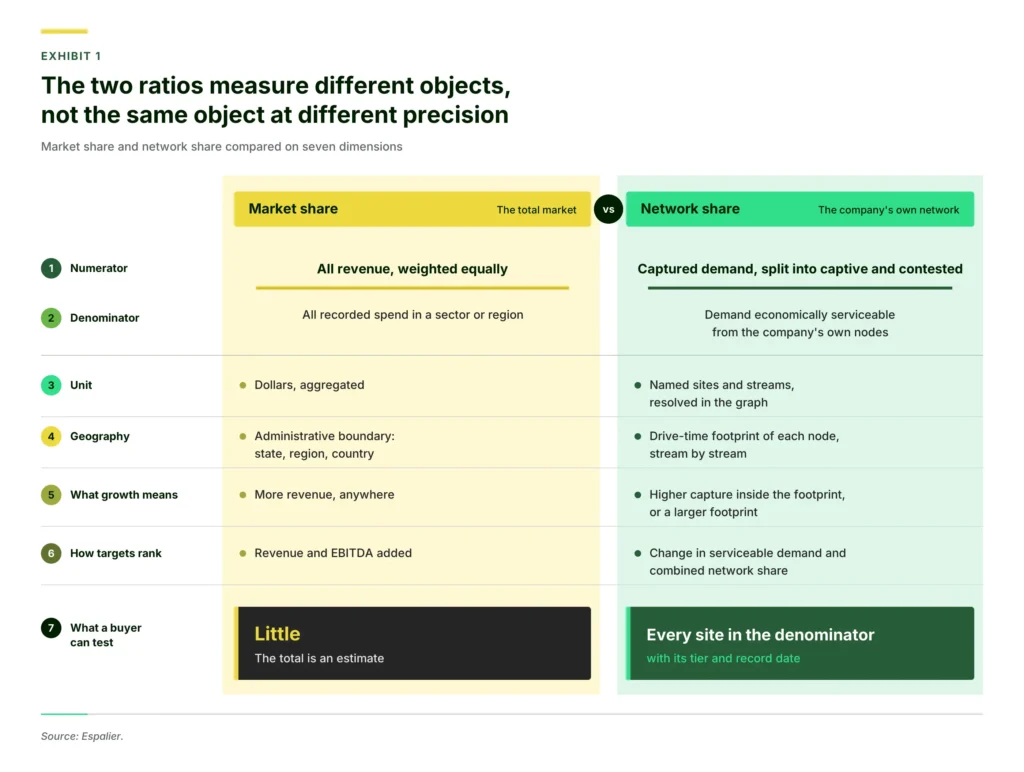
That makes the node’s footprint, not the company, the unit of competitive position. A company with modest national share can be dominant around a single treatment facility, while a larger competitor with no outlet of its own in that region pays a rival’s gate fee on every load and wins only on price. Revenue cannot tell the two apart. Network share can, because its denominator is drawn around the assets. Exhibit 1 sets the two ratios side by side.
Trucks follow demand. Demand follows the node. A market share figure that does not know where the nodes are does not know where the business competes.
The radius is not a circle
A node’s economic reach is not a distance. It ends where the round-trip cost of serving a site, plus the cost of processing at the node, exceeds the price the site will pay or the delivered cost from the nearest competing outlet. That boundary follows drive time rather than miles. It stretches along interstates, stops at a toll crossing or a truck-restricted corridor, and contracts where congestion is predictable.
It also differs by stream. A high-value, low-volume stream such as lab-pack hazardous waste justifies hours on the road; a bulk, low-margin stream justifies far less. The same facility therefore has several footprints at once, one for each stream it is permitted to accept, and none at all for a stream it cannot accept, however close the generator. The circle drawn on a CIM map blends every footprint into one, and the blend is always more generous than any of its parts.
Identical market share can conceal opposite businesses

Neither number is a verdict. Platform A’s 40% signals density and a structural cost advantage, but also a ceiling: from here, growth depends on extending reach. Platform B’s 8% signals a long runway inside its footprint, but one it has not converted, while every load it hauls pays a competitor’s gate fee. The two need different value creation plans, different acquisition screens and different diligence. Market share recommends the same plan for both.
Captive and contested demand are different assets
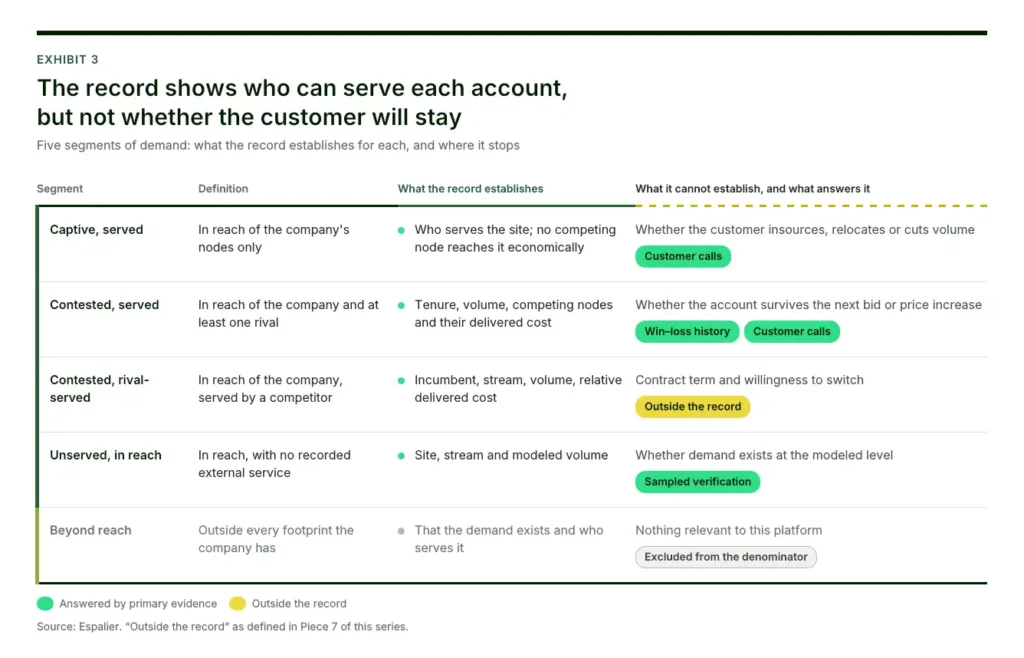
Inside the denominator, demand divides again. Captive demand sits within economic reach of one node only, the company’s. Contested demand sits within reach of two or more. Captive volume supports pricing and is the hardest revenue for a buyer to lose; contested volume is where share is won and lost and where price increases leak. A platform whose captured demand is mostly captive is a different credit from one whose captured demand is mostly contested, at the same headline share.
The construct is not specific to waste
Any business that moves material between fixed nodes and dispersed customers is measured against the wrong denominator by market share. Ready-mix concrete must generally be discharged within about ninety minutes of batching, so each plant’s market is a drive-time polygon and national share is close to meaningless. Aggregates are heavy and cheap relative to haul cost, which makes a quarry’s position a local question. Industrial laundry and uniform rental run routes from a plant whose capacity and drive time bound the territory. In each case the useful question is identical: what share of the demand reachable from this node does the company hold, and how much of it could no one else serve?
Antitrust review already works this way. Remedies in waste consolidations have been defined local market by local market, around collection areas and disposal outlets rather than national totals. A deal team that leads with national market share is using a denominator the regulator has already set aside.
Network share is a claim, so it carries a tier
The denominator is the harder half to defend. The numerator, named accounts the company serves, is largely Observed. The denominator rests on drive-time assumptions, pricing, permit interpretation and capacity, and much of it is Modeled. That is a property to publish, not a weakness to hide. Every network share figure should state how its denominator splits across tiers, the reach assumptions behind it and the date of the records it rests on. A 40% network share on an 80% Observed denominator is a different claim from the same figure on an 80% Modeled one.
Once tiered, network share becomes the anchor for the rest of the underwriting. The reconciliation page tests management’s whitespace claim against the serviceable denominator, not the sector total. Acquisition targets are ranked by how much they change combined serviceable demand rather than by revenue added, the subject of Piece 11. Growth is underwritten on whether incremental volume is economic to serve, the subject of the next piece.
Market share tells a buyer how big a business is. Network share tells them where it can win, what it cannot lose, and where its next node has to be.
Underwrite the footprint, not the sector
A sector total is a fact about an industry. A serviceable denominator is a fact about a business. Dividing the first into revenue produces a number that flatters the runway and hides the moat, and a careful buyer will rebuild the denominator before pricing either. The seller who has already built it, site by site and tier by tier, controls the conversation about what the platform is worth.
THE ESPALIER VIEW
Network share is not a sharper estimate of the same thing. It measures a different object: the demand a company’s fixed nodes can economically serve, split into captive and contested, with every figure tiered and dated. It is the first measure in this series that requires the graph to exist, and the first one a buyer should ask for.