
Sellers commission a quality of earnings report to defend the past. The growth case has no comparable convention, so buyers rebuild it themselves and price what they cannot test. A single reconciliation page, tracing every line of the growth bridge from the narrative through its operating assumptions to the evidence, turns a forecast to be believed into a set of conditions to be tested. Its value lies in the gaps it shows, not in the agreement it claims.
Sellers defend the past with evidence and the future with narrative
The past arrives in a sale process already audited. A sell-side quality of earnings report has become close to standard in sponsor-backed deals: a Forvis Mazars partner estimates that at least 90% of the PE-backed transactions they see carry one, against about half of founder-led lower-middle-market businesses by the same estimate. Buyers appear to pay for it. GF Data’s analysis of 360 transactions completed since the third quarter of 2024 found that sellers who ran a sell-side QoE achieved an average of 7.4x TEV/EBITDA, against 7.0x for those who did not. That is an association rather than proof of cause, but its direction is consistent with what a buyer would expect to pay for evidence.
The growth case is treated differently. It arrives as a narrative in the CIM and a bridge in the model: organic growth, new geographies, acquisitions, margin improvement, each with a number attached. The buyer is asked to accept the narrative and test the bridge, but nothing in the document connects one to the other. So the buyer’s team does what it usually does. It rebuilds the case from its own sources, finds the places where the pieces do not add up, and prices them.
That is where processes break. Asked for the single biggest reason deals failed to close in 2025, respondents to Axial’s March 2026 survey of 107 lower-middle-market participants, from both the buy and the sell side, put valuation expectations first, at 28.3%, and diligence findings second, at 24.5%. Between them, the two describe the ground a growth case occupies: what the seller believes the business is worth, and what the buyer can verify.
The past arrives audited. The future arrives as a story. A buyer prices the second at the confidence of its weakest assumption.
A growth case is assembled from sources nobody reconciled
A typical growth case draws on five sources: a market study, customer and contract data, management’s forecast, an acquisition pipeline, and the operating plan. Each is usually prepared by a different person, for a different purpose, at a different time. The market study sizes demand across a region. The customer data shows who buys today. The forecast states what management intends to achieve. The pipeline lists companies someone has spoken to. The operating plan assumes the trucks, routes and processing capacity will be there.
Each document can be internally consistent without ever having been checked against the others.
The questions a buyer asks in week four are the ones that sit between them. Can the company reach the customers the plan assumes, from the facilities it actually owns? Is there enough route or processing capacity to serve the volume the forecast adds? Which of the acquisitions in the bridge are named, engaged businesses, and which are a number standing in for a company nobody has identified yet?
A CIM seldom answers them directly, because each sits at a seam between two sources and belongs to neither.
The page reconciles three things, line by line
The reconciliation page is one page in the evidence book that connects the investment narrative, the operating assumptions and the financial projections. It does so for every line of the growth bridge, in the same order the model presents them.
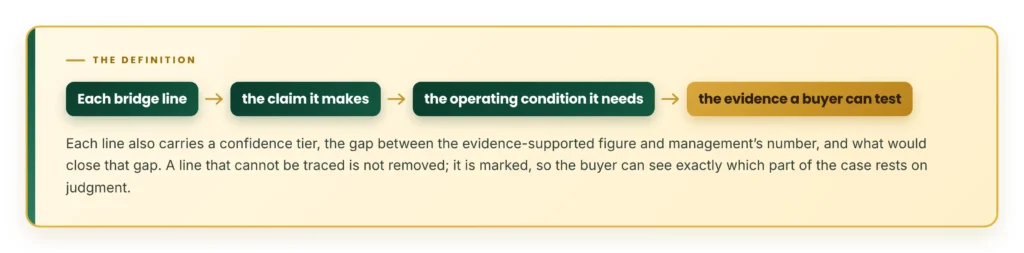
Four kinds of growth claim appear in almost every environmental services bridge. Each rests on a different operating condition, and each can be tested against a different body of evidence.
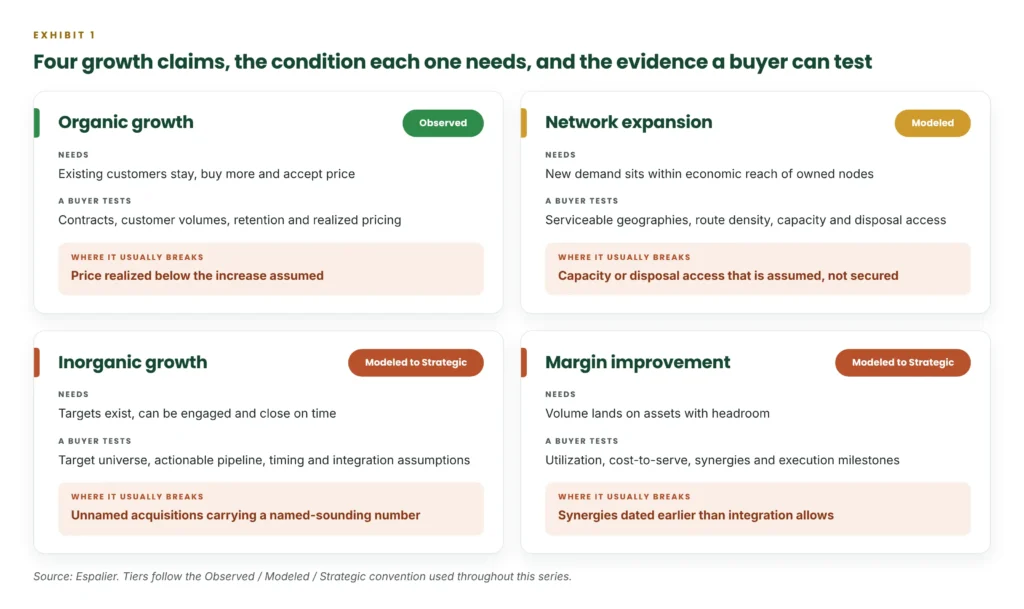
The tier column does most of the work. Organic growth resolves largely to the company’s own trading history, which is why buyers tend to leave it nearly intact. Network expansion resolves to the denominator described in the network share piece of this series: demand within economic reach of the company’s fixed nodes, not demand in the region. Inorganic growth and margin improvement rest increasingly on things that have not happened yet, and the page should say so rather than present them in the same typeface as the contracted revenue above them.
The page is worth most where it disagrees
The instinct in preparation is to make the reconciliation agree with management’s plan. That is the one outcome that makes the page worthless. A bottom-up build that arrives at exactly the forecast tells a buyer that it was either reverse-engineered or never independent, as the earlier piece on CIM claims argued. The value of the page is that it can show a gap, and that the gap is specific.
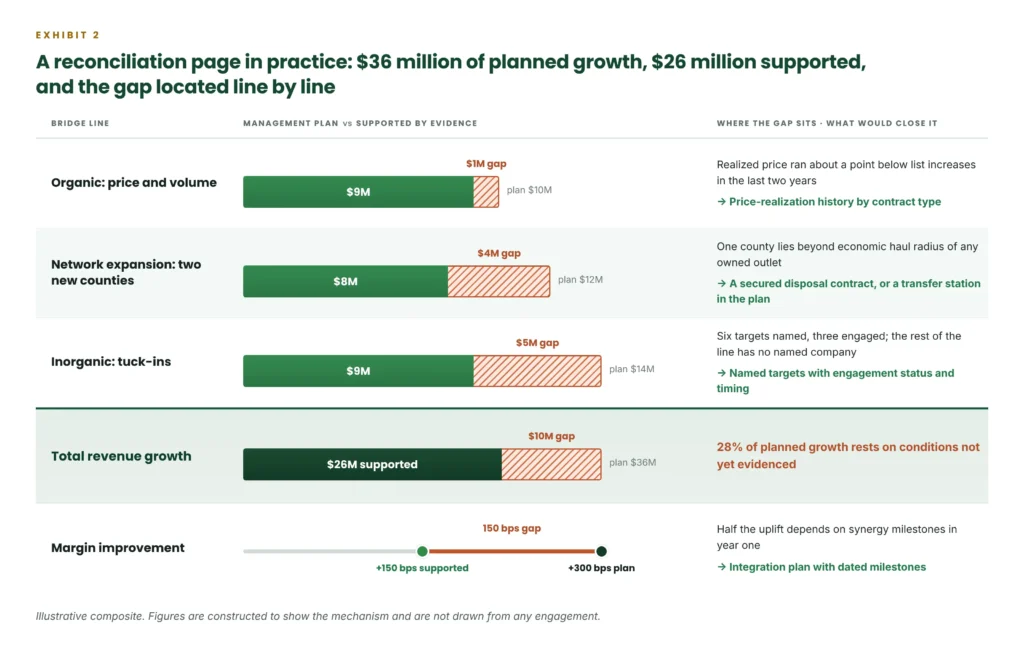
In the illustration, the gap is $10 million of a $36 million growth case. Presented this way, it is not a weakness to bury. It is the part of the case the seller can still work on before launch, priced in the open, rather than the part a buyer discounts silently at a number the seller never sees. More useful still, the gap is located. The buyer knows that the pricing line is close, that the network line turns on one disposal contract, and that the inorganic line needs named companies behind its last $5 million. Those are diligence questions with an owner and a date.
A reconciliation that agrees with management proves nothing. A reconciliation that shows a $10 million gap, line by line, proves the build is independent.
Each party in the process uses the page differently
The same page does different work for each party, and at different points in the process.
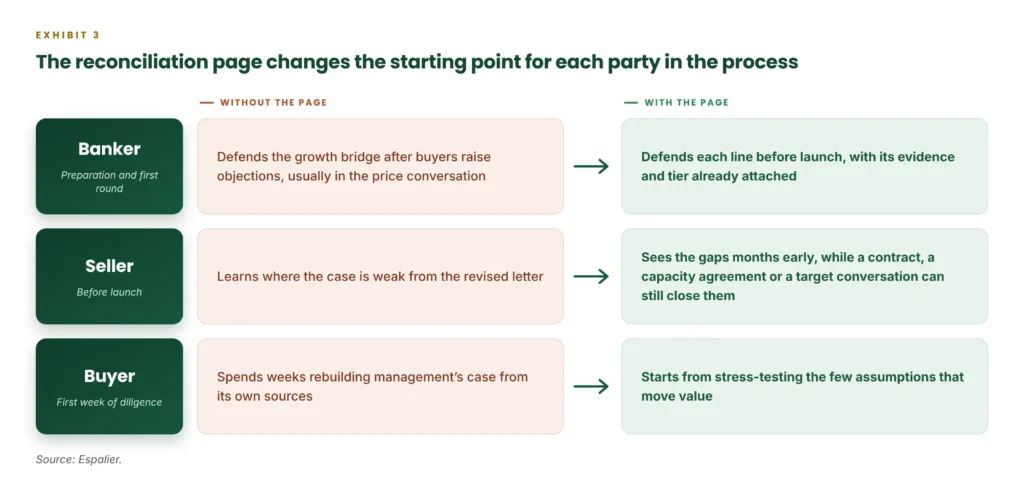
For the banker, the page turns a defensive conversation into a prepared one: the questions that would otherwise arrive as valuation objections arrive as lines already answered. For the seller, timing is the point. A disposal contract is far easier to sign, and a pipeline far easier to advance, in the months before a process than in the weeks after first indications. For the buyer, the page changes the starting point, from rebuilding the case to testing it, which is the shift the earlier piece on stress-testing the build described.
The obvious objection: the page hands the buyer the argument
Any seller will ask why it should map its own gaps for the other side. The answer is that the buyer will find them regardless. The only choice is whether they surface as a named diligence item or as a discount, a structure term or a quiet change in the next letter.
Structure is already where unverifiable growth goes. SRS Acquiom’s 2026 deal terms study, covering more than 2,300 private-target acquisitions, found earnouts in 24% of deals completed in 2025, up from 22% the year before (excluding life sciences deals). An earnout is, in effect, a growth claim that neither side could resolve before signing. A gap with a named remedy is a diligence item with a cost and a date. A gap without one is a discount, or an earnout, set at terms the seller did not choose.
Disclosure can still be staged. As the piece on CIM claims set out, the page can show method and tier in the first round, aggregated evidence after indications, and the underlying records only in confirmatory diligence. The page discloses how the case was built before it discloses the data behind it.
In environmental services, the reconciliation runs through the network
The page matters more in route-based sectors than in most, because the conditions that decide growth are physical and local. Whether projected growth is real depends on actual service coverage, route economics, processing capacity and an executable M&A pipeline, and each of these can be checked against records before a process starts.
The inorganic line deserves particular care, because of how this market consolidates. Of the 2,544 U.S. waste management transactions in Espalier’s dataset for 2020 to the first quarter of 2026, 88% of targets were classified as local players. The scale is small even for the most active buyers: Waste Connections’ 19 acquisitions in 2025 added about $330 million of annualized revenue, roughly $17 million each. At that scale, an inorganic line of $14 million is a handful of named businesses at most, not a market. A reconciliation page that cannot name them is showing the buyer an aspiration.
The reconciliation page also has a counterpart. The boundary page described earlier in this series lists the questions the evidence cannot settle, such as customer intent, management quality and integration reality. As that piece put it, the reconciliation page proves the build can disagree with management; the boundary page proves it can disagree with itself. Together they show a buyer exactly how far the evidence carries the growth case, and where judgment has to take over.
Reconcile the case before the buyer does
A CIM is read as a narrative and underwritten as a list of conditions. The reconciliation page writes that list down before the buyer does, in the seller’s order and with the seller’s evidence, and it shows where the evidence stops.
The quality of earnings report became standard for the past, and in GF Data’s sample the sellers who evidenced their history traded at a higher multiple than those who did not. The growth case is the next part of the CIM to need the same treatment. Once sellers in a sector start showing their reconciliation, line by line with the gaps visible, a bridge that arrives without one will read as a case the seller chose not to test, and buyers will price it accordingly.
THE ESPALIER VIEW
A strong CIM tells buyers what a business could become. The reconciliation page shows what must be true for that outcome, where the evidence stands today and what would close each gap. Espalier builds the evidence beneath it, connecting market and customer intelligence with service coverage, route economics, processing capacity and a named M&A pipeline, so that every line of the growth bridge resolves to records before a buyer asks.