Why Liquid Waste Stayed Fragmented, and Why Its Consolidation Will Be Won Differently
Environmental services has spent three decades consolidating. Solid waste went first: hundreds of family-owned haulers absorbed into national platforms, landfill networks internalized, route systems rationalized. Hazardous waste followed, with permitted treatment capacity concentrating into a handful of operators whose pricing power is now structural.
One segment missed every wave.
Liquid waste (septage, grease and grit trap service, non-hazardous industrial wastewater, decentralized treatment) remains what solid waste was a generation ago: thousands of local operators, family ownership, relationship-driven books of business, and no national leader.
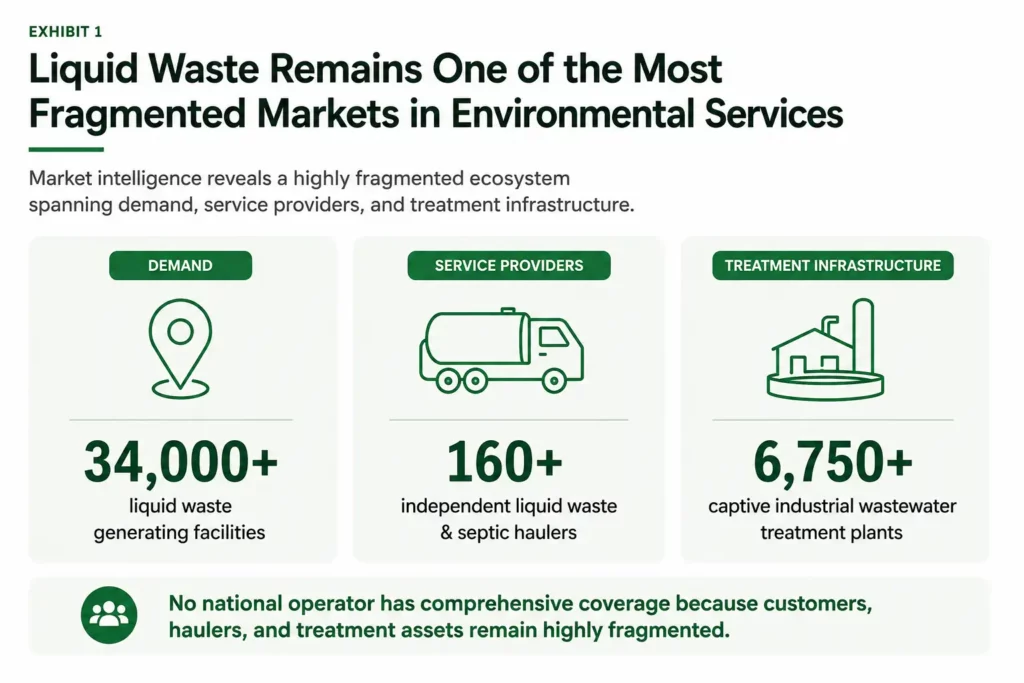
The scale of that fragmentation is easy to underestimate until it is mapped. In a single state, a recent Espalier market study identified more than 34,000 liquid waste-generating facilities, served by 160+ independent septic pumping companies and 75+ treatment and municipal receiving facilities. Across the U.S. East Coast, 6,750+ captive (non-municipal) wastewater treatment plants operate outside the public system, tended by a long tail of 50+ third-party operators, none with dominant share.
Meanwhile, the demand side is not shrinking. Aging septic infrastructure, FOG pretreatment enforcement, industrial pretreatment standards, and the steady privatization of treatment services are all expanding the work to be done, even as the supply side remains atomized.
The question is not whether liquid waste consolidates. Capital is already circling the segment. The question is why it has not consolidated yet, because the answer determines who wins when it does.
The Insight
In solid waste, the roll-up was won with balance sheets. In liquid waste, it will be won with visibility. The binding constraint is not capital. It is the ability to see a market that has never been mapped.
Every previous consolidation in environmental services ran on legible markets. Solid waste had franchise areas, municipal contracts, and landfill gate volumes. Hazardous waste had the manifest system: a regulatory dataset that told every operator exactly who generated what, in what volume, and where it went.
Liquid waste has neither. Its data is scattered across state discharge permits, POTW pretreatment programs, county health departments, and grease trap inspection records: fragmented, inconsistent, and largely unread. Acquirers cannot efficiently consolidate what they cannot see. That is the real reason the segment stayed fragmented, and it is why the consolidation playbook must change.
Why Liquid Waste Stayed Fragmented
Three structural features have protected the segment’s fragmentation:
- The streams are heterogeneous. “Liquid waste” is not one market. Septage, grease trap waste, grit, oil-water emulsions, and low-solvent aqueous industrial streams each carry different treatment requirements, different regulatory pathways, and different customer relationships. In Houston alone, Espalier sized 280M+ gallons per year of industrial wastewater generation, but only 100M+ gallons, across three specific waste form codes, was compatible with a given operator’s permitted treatment capability. Compatibility, not volume, defines the addressable market.
- The data has no center of gravity. There is no national manifest for non-hazardous liquids. Building a demand-side view of one state required assembling 34,000+ facility records from dozens of sources. That is work no local operator, and few acquirers, have ever done. The market is not opaque because it is small. It is opaque because nobody built the map.
- Route economics are local and invisible. The value of a liquid waste account is a function of its distance from a truck that is already moving and an outlet that can legally receive the load. That value does not appear on a target’s financial statements. Two operators with identical revenue can have radically different route density, and radically different worth to a consolidator.
The consequence: diligence in liquid waste has historically meant trusting a seller’s story. The operators themselves often cannot quantify their own density, their own share, or their own whitespace. Fragmentation persisted not because the segment resists scale, but because scale had no reliable information to build on.

What the Last Roll-Up Teaches
Solid waste offers the closest precedent, and a measurable one. In 1996, the industry’s top three companies controlled 37% of the U.S. landfill market. By 2021, the top three held 59%. The intervening 25 years, spanning the USA Waste–Waste Management combination, the Republic–Allied merger, and thousands of tuck-in acquisitions, represent the most complete consolidation arc in environmental services.

Three lessons from that arc translate directly to liquid waste:
- Density beat geography. The most successful consolidators did not plant flags in new regions. They bought overlapping routes, collapsed redundant trucks, and let stop density drive margin. Tuck-ins outperformed trophies.
- Internalizing the outlet drove the margin. In solid waste, the landfill was the profit engine; collection fed it. The liquid waste equivalent is the treatment gate: the permitted facility that receives septage, grease, and industrial streams. Operators who pair dense routes with owned outlets replicate the internalization economics that built the solid waste majors.
- The map mattered as much as the money. The best acquirers knew their local markets street by street. But solid waste was legible enough to learn by experience. Liquid waste is not. That is why, this time, the map has to be built deliberately, from data, before the capital deploys.
There is one more difference, and it favors the disciplined. The solid waste roll-up was executed with paper maps and relationship knowledge. The liquid waste roll-up will happen in an era when 34,000 generators can be mapped, scored, and overlaid against supply in months. The informational advantage that took the solid waste major’s decades to accumulate can now be assembled before the first acquisition closes.
Route Density Is the Whole Game
If visibility is the entry ticket, density is the prize. Liquid waste is a logistics business wearing an environmental services uniform: trucks, stops, gallons, and gate fees. The cost of serving a customer is dominated by the distance between that customer and a route already being driven.
Most operators cannot see their own density. In a recent route-intelligence engagement, Espalier ingested GPS telemetry from just four active trucks in the Northeastern U.S. and mapped the commercial landscape around their existing movements. The result: 50,000+ potential waste generators sat within 1.5 to 3 miles of routes already being driven, and when screened through a physical serviceability framework, more than 80% were feasible to integrate.

The pattern repeats at the account level. When a national septic and wastewater operator targeted the quick-service restaurant segment, Espalier mapped 2,000+ locations across two QSR networks and found ownership concentrated among a small set of multi-state franchisees, meaning a handful of relationships could unlock hundreds of stops clustered along existing service areas. Density, it turns out, can be acquired one contract at a time, not only one company at a time.
And in Houston, proximity converted a market statistic into a commercial plan: of 2,000+ generators mapped across the MSA, 160+ sites within close range of the client’s facility produced roughly 24 million gallons per year of compatible streams: near-term volume reachable with minimal incremental routing.

The New Model
The operators and investors moving first in liquid waste are running a different process: one that treats market intelligence as the first investment, not the last diligence item.
- Opportunity mapping before origination. Building the demand-side registry (every generator, categorized by stream, size, and location) before selecting targets. The acquisition thesis emerges from the map, not the broker book.
- Demand–supply overlay as valuation input. Scoring each target’s routes against surrounding generator density, competitor proximity, and outlet access. Two identical P&Ls stop being identical when one sits inside a dense, under-served cluster and the other does not.
- Outlet intelligence as strategy. Mapping the receiving infrastructure (private treatment facilities, POTW gates, and the 6,750+ captive plants operating outside the municipal system) to identify where internalization economics are available and where disposal risk is concentrated.
- Decision tools, not static reports. Replacing one-time market studies with living dashboards that filter by geography, proximity, segment, and competitor presence, so corporate development and route managers work from the same picture.

Intelligence in Action
Two recent engagements illustrate the model.
For a leading liquid waste management company pursuing growth in Colorado, Espalier built the full market picture: 34,000+ generating facilities segmented by waste type, geography, size, and industry; 75+ competitor and municipal receiving facilities and 160+ septic pumping companies geolocated for supply-side context; and a proximity-based demand–supply overlay identifying where the client held a structural distance advantage over every competitor. The deliverable was not a report. It was an interactive decision-support tool the client’s team uses to evaluate and prioritize opportunities dynamically.
For a regional treatment operator in Houston seeking to diversify incoming streams, Espalier sized the industrial wastewater market at 280M+ gallons per year, filtered it to 100M+ gallons of permit-compatible volume across three priority form codes, mapped 2,000+ generators, flagged 160+ near-range sites worth ~24M gallons annually, and benchmarked 14 local treatment providers to expose geographic and capability whitespace. The client’s expansion plan now targets streams its infrastructure can already accept, generated by facilities its trucks can already reach.
In both cases, the finding was the same one that defined the solid waste era: the biggest opportunities were not in new markets. They were in seeing the existing market more clearly than anyone else.
The Forward View
Liquid waste will consolidate. The demand base is durable, the regulatory drivers are tightening, the seller demographics favor transactions, and the internalization economics are proven. What remains undecided is who captures the arc, and the deciding variable looks different from last time.
What this means in practice
For operators: route density is the compounding asset. The cheapest gallon of growth is almost always within three miles of a truck you already run, and the operators who can see that whitespace will out-earn identical fleets that cannot.
For investors: platform selection should weight market position over reported financials. A modest operator inside a dense, under-mapped generator cluster with outlet access is a better platform than a larger one in a contested corridor.
For acquirers: the diligence edge has moved outside the data room. The target’s real value sits in the market around it: generator density, competitor proximity, and receiving infrastructure that no CIM will show you.
The last great roll-up in environmental services will not be won by whoever raises the most capital. It will be won by whoever sees the market most clearly..